

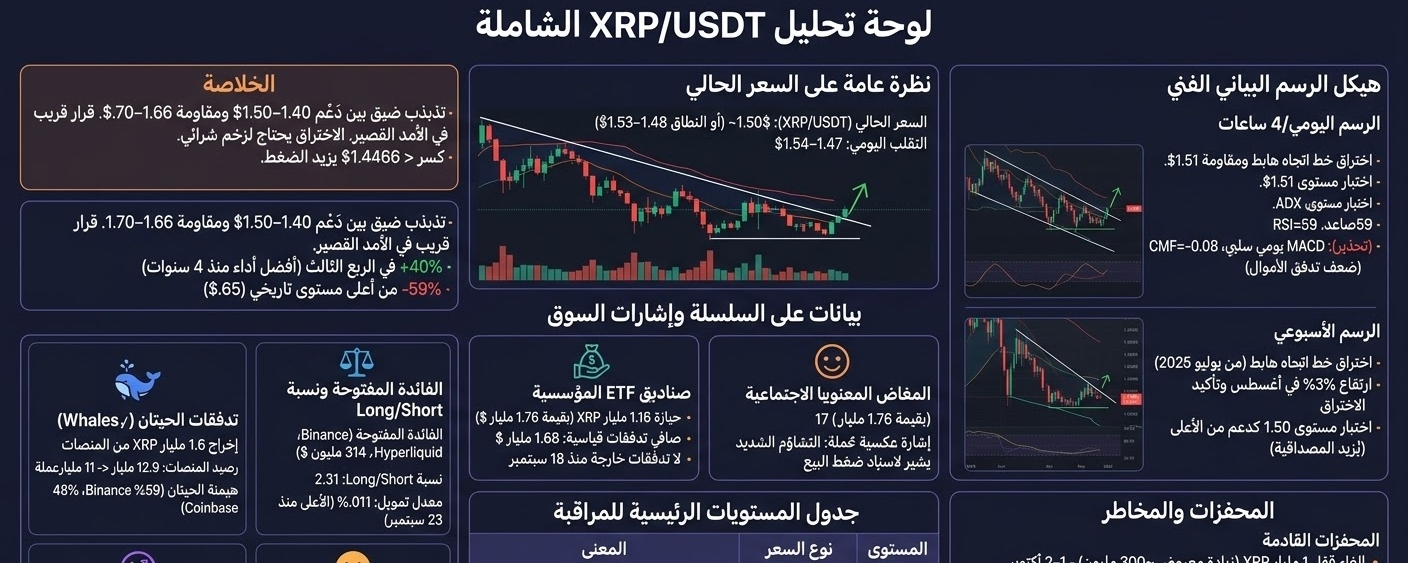

#XRPUSDT In the short term, it makes a decision; the breakout requires buying momentum, and a decline below $1.4466 could increase downward pressure.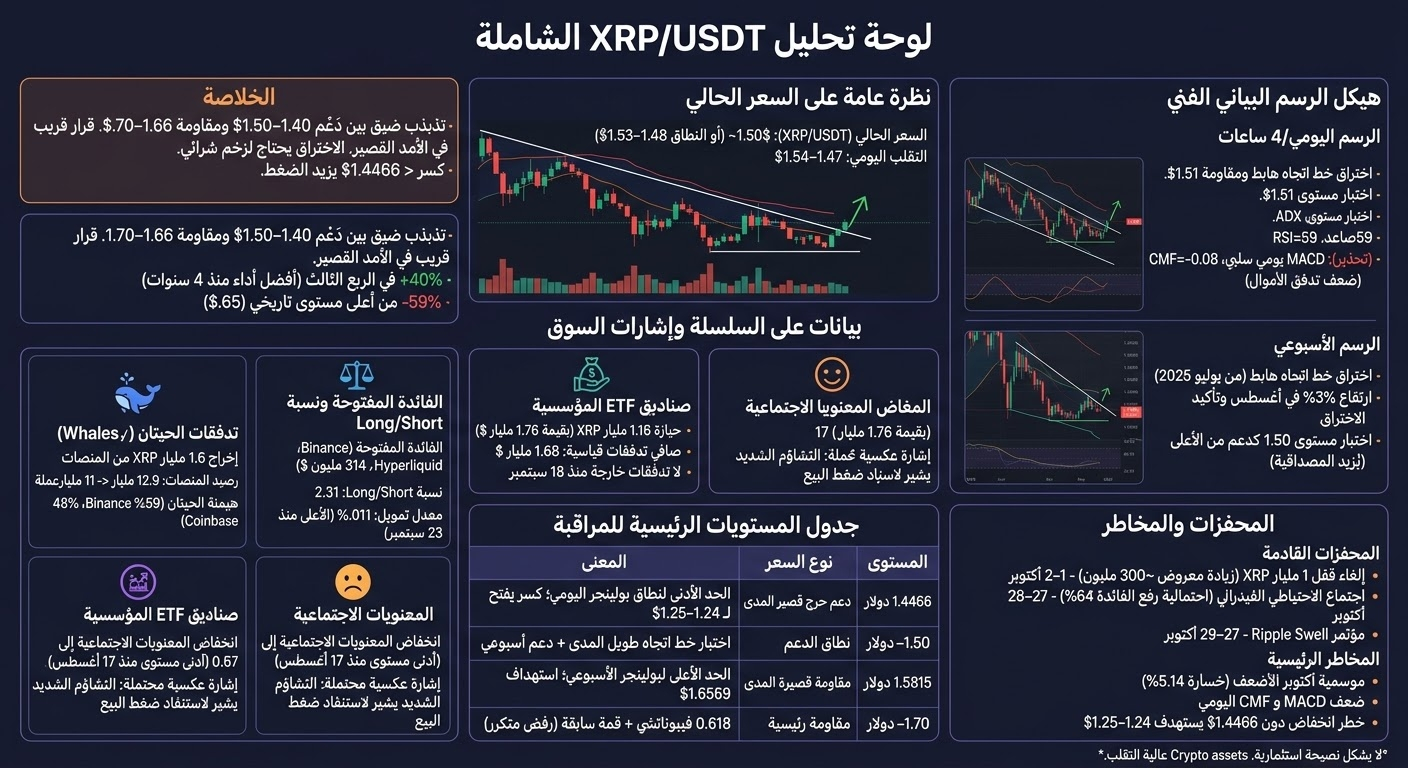
Overview of the current price
Currently #XRP is trading around $1.48–$1.53, with tight intraday fluctuations within the range of $1.47–$1.54. Although it rose by more than 40% in Q3 (the best third-quarter performance in four years), it is still about 59% below the all-time high of $3.65.
On-chain data and market signals
Whale flows and platform outflows: Since April, the balance on platforms $XRP has fallen from about 12.9 billion to 11 billion XRP. In just the past two weeks, about 1.6 billion XRP has left platforms. Whales holding more than one million XRP dominate withdrawal activity over #Binance and others (the withdrawal share in the Million+ category rose to about 60% on Binance and 48% on others). This pattern also appeared two days before the August surge.
Open interest and Long/Short ratio: Open interest rose for $XRP on Binance from $553 million to $580 million, and on others from $284 million to $314 million. The Long/Short ratio is 2.31, and the funding rate is 0.01%, the highest level since September 23.
Institutional #ETF funds: U.S. spot XRP funds hold about 1.16 billion XRP (worth roughly $1.76 billion), with total record-high net inflows of about $1.68 billion, and they have not recorded outflows since September 18.
A contrarian sentiment signal: XRP social sentiment fell to 0.67 (the lowest since August 17), with negative posts outweighing positive ones. But Senti..ment believes extreme pessimism may indicate selling pressure is exhausted, which could be a potential contrarian signal.
Technical chart structure
Daily/4-hour chart: XRP has recently broken above the descending trendline and the resistance line at $1.51, and is currently testing the $1.51 correction level. The ADX indicator is trending upward, and RSI is at 59; upside momentum still dominates. However, the daily MACD has turned negative, and Cha..ikin Money Flow has fallen from 0.01 to -0.08, suggesting weakening money flow.
Weekly chart: XRP broke above the descending trendline that has been capping the price since July 2025. It rose about 53% in August and confirmed the breakout. The current test at $1.50 is a test from above the prior trendline ceiling; if it holds as support, technical credibility will increase.
Key levels to watch
Price level meaning
$1.4466 is a critical short-term support: the minimum level of the daily Bollinger range; a drop below it could open the way toward $1.24–$1.25.
$1.40–$1.50 support range: long-term trendline test zone + weekly support range
$1.5815 short-term resistance: the upper bound of the weekly Bollinger; the breakout targets $1.6569.
$1.66–1.70 is key resistance: the 0.618 Fibonacci level + a prior peak; repeated rejections here in August and September
Next catalysts
· October 1–2: Release of $1 billion worth of XRP from collateral. The effective inflow/outflow range depends on the amount re-locked from #Ripple (previously 700–800 million was re-locked); if about 700 million is re-locked, the net increase in supply would be roughly 300 million.
· October 27–28: Federal Reserve meeting. The probability of a rate hike priced by the market is 64%, which could weigh on risky assets.
· October 27–29: Ripple Swell conference. An important catalyst at the ecosystem level.
Key risks
Seasonally, October is traditionally the weakest month for XRP, with an average monthly loss of about 5.14%, and the month closed lower in both 2024 and 2025. In the short term, weakening daily MACD and the shift of money flow toward the negative side increase the risk of continued choppiness or a decline. If the price drops below $1.4466 effectively, it may target the $1.24–$1.25 support range.
Note: The above is an objective analysis based on available data and does not constitute investment advice. Crypto assets are highly volatile, and trading decisions should be based on your own analysis and risk management.
