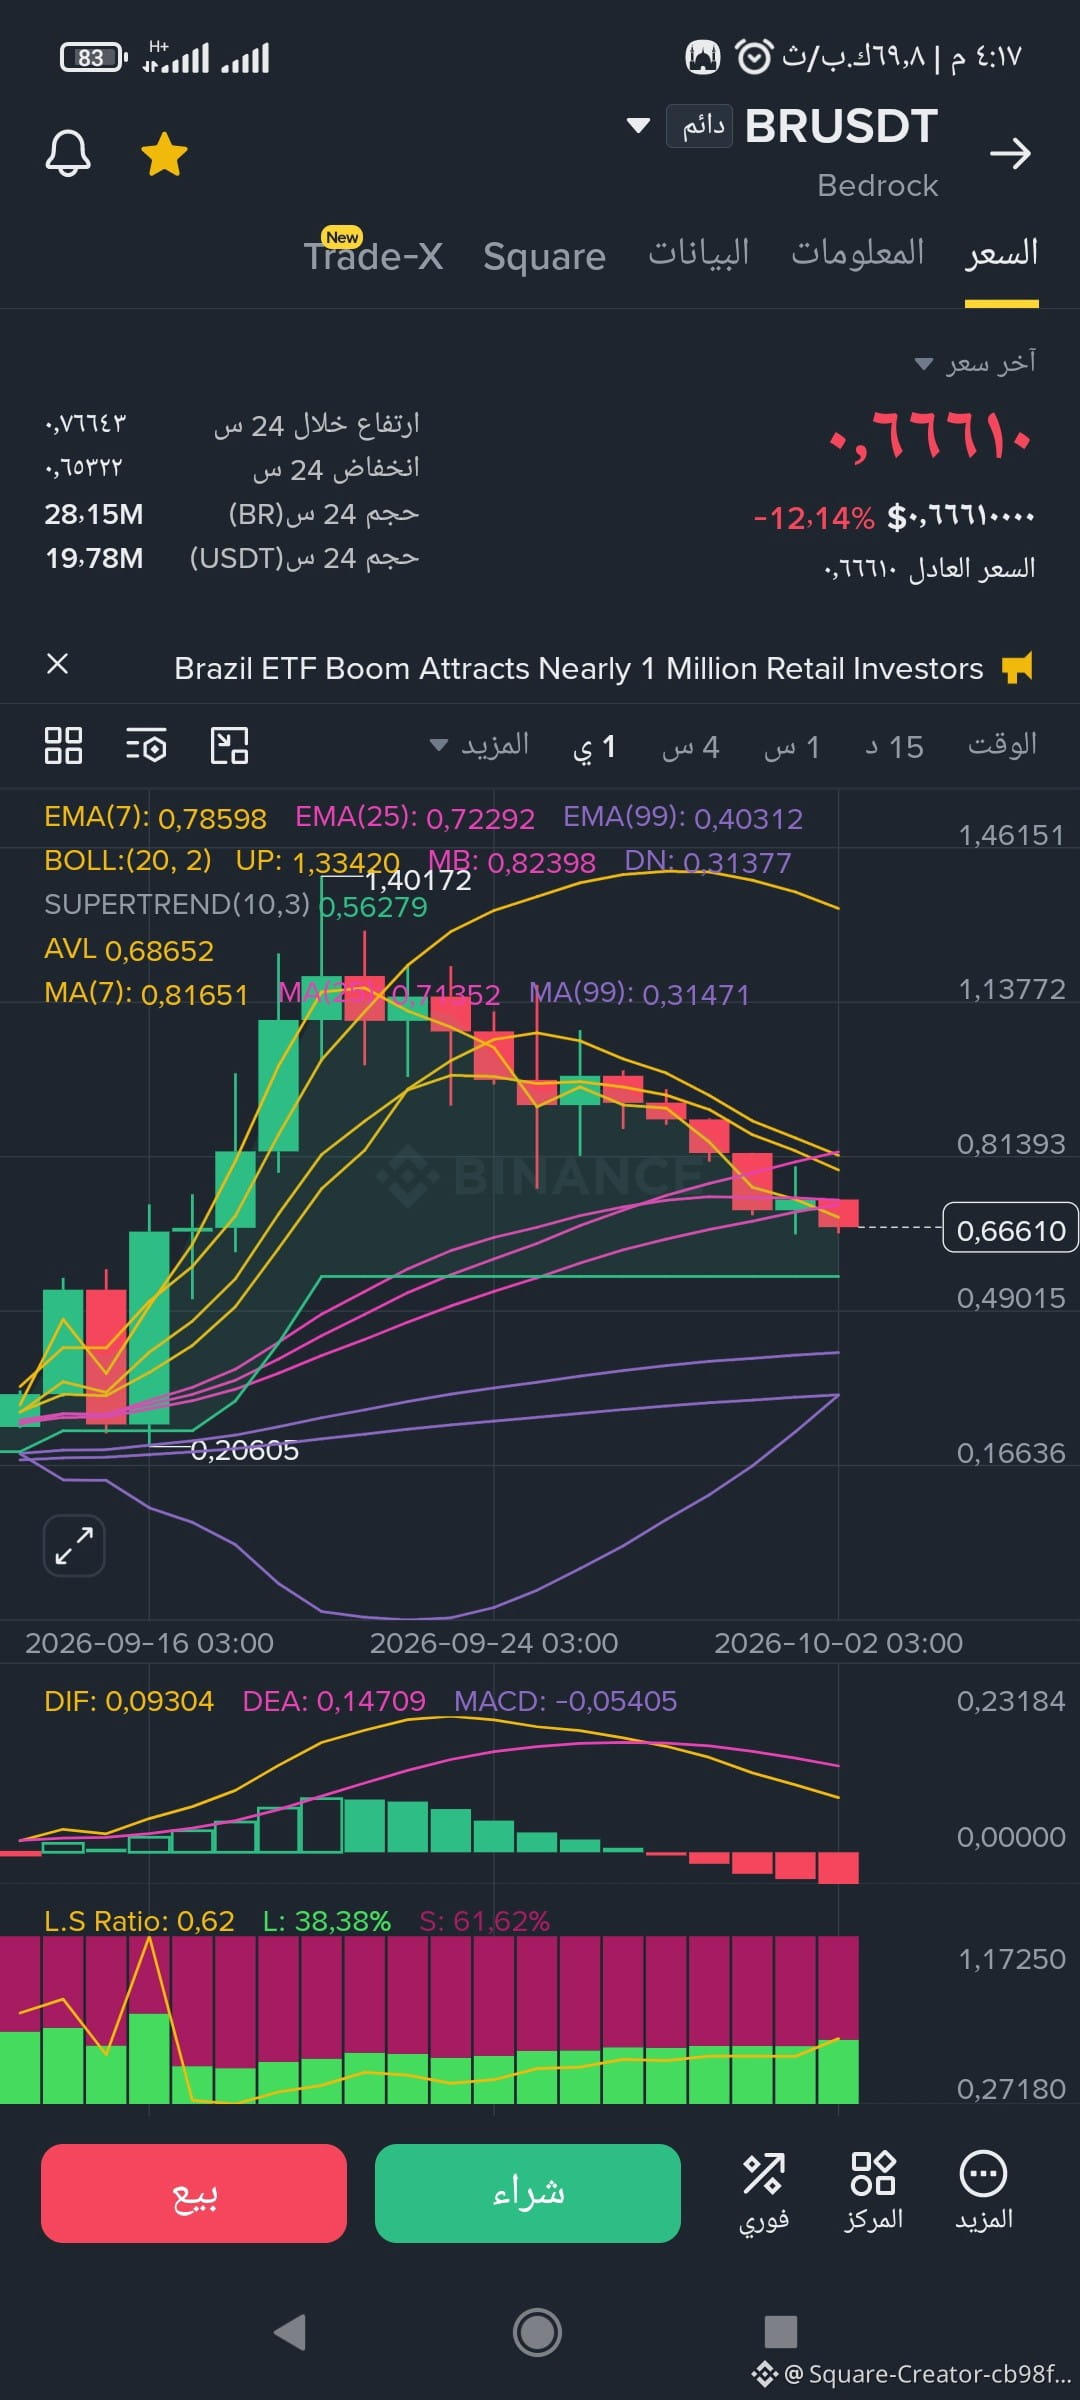
$BR 📉 The Quiet Drop of BR on Binance: Is It Natural Correction or the Start of an Accumulation Phase?
The coin has lost a large portion of its value since the peak, but the most important thing is not only the amount of the decline—it's how it happens.
Group sell-offs usually show on the chart through:
Long bearish candles.
A sudden jump in sell volume.
Widening of the trading range.
Large liquidations in the futures market.
Rapid breakdown of support zones.
But when the decline is gradual with decreasing volatility, the market may be in a phase of repricing or absorbing liquidity rather than a full-on collapse.
🐋 Where does the importance of whales and liquidity lie?
With a coin like BR, it's not enough to watch the price.
The most important thing is monitoring the relationship between:
Price + trading volume + Open Interest + Funding Rate + liquidity on the order book.
If the price drops while trading volume gradually declines, this may mean that sell pressure is starting to weaken.
However, if the price drops alongside:
Rising Open Interest + larger sell sizes + major Long liquidations
then this is a different scenario, because it could mean new sell positions are being entered or buyers are being forced out.
If the price continues to set new lows alongside rising sell volumes, Open Interest, and increasing liquidation of Long positions, then the decline may not be over yet.
The coin has lost a large portion of its value since the peak, but the most important thing is not only the amount of the decline—it's how it happens.
Group sell-offs usually show on the chart through:
Long bearish candles.
A sudden jump in sell volume.
Widening of the trading range.
Large liquidations in the futures market.
Rapid breakdown of support zones.
But when the decline is gradual with decreasing volatility, the market may be in a phase of repricing or absorbing liquidity rather than a full-on collapse.
🐋 Where does the importance of whales and liquidity lie?
With a coin like BR, it's not enough to watch the price.
The most important thing is monitoring the relationship between:
Price + trading volume + Open Interest + Funding Rate + liquidity on the order book.
If the price drops while trading volume gradually declines, this may mean that sell pressure is starting to weaken.
However, if the price drops alongside:
Rising Open Interest + larger sell sizes + major Long liquidations
then this is a different scenario, because it could mean new sell positions are being entered or buyers are being forced out.
If the price continues to set new lows alongside rising sell volumes, Open Interest, and increasing liquidation of Long positions, then the decline may not be over yet.