#zcash较9月峰值回落21%
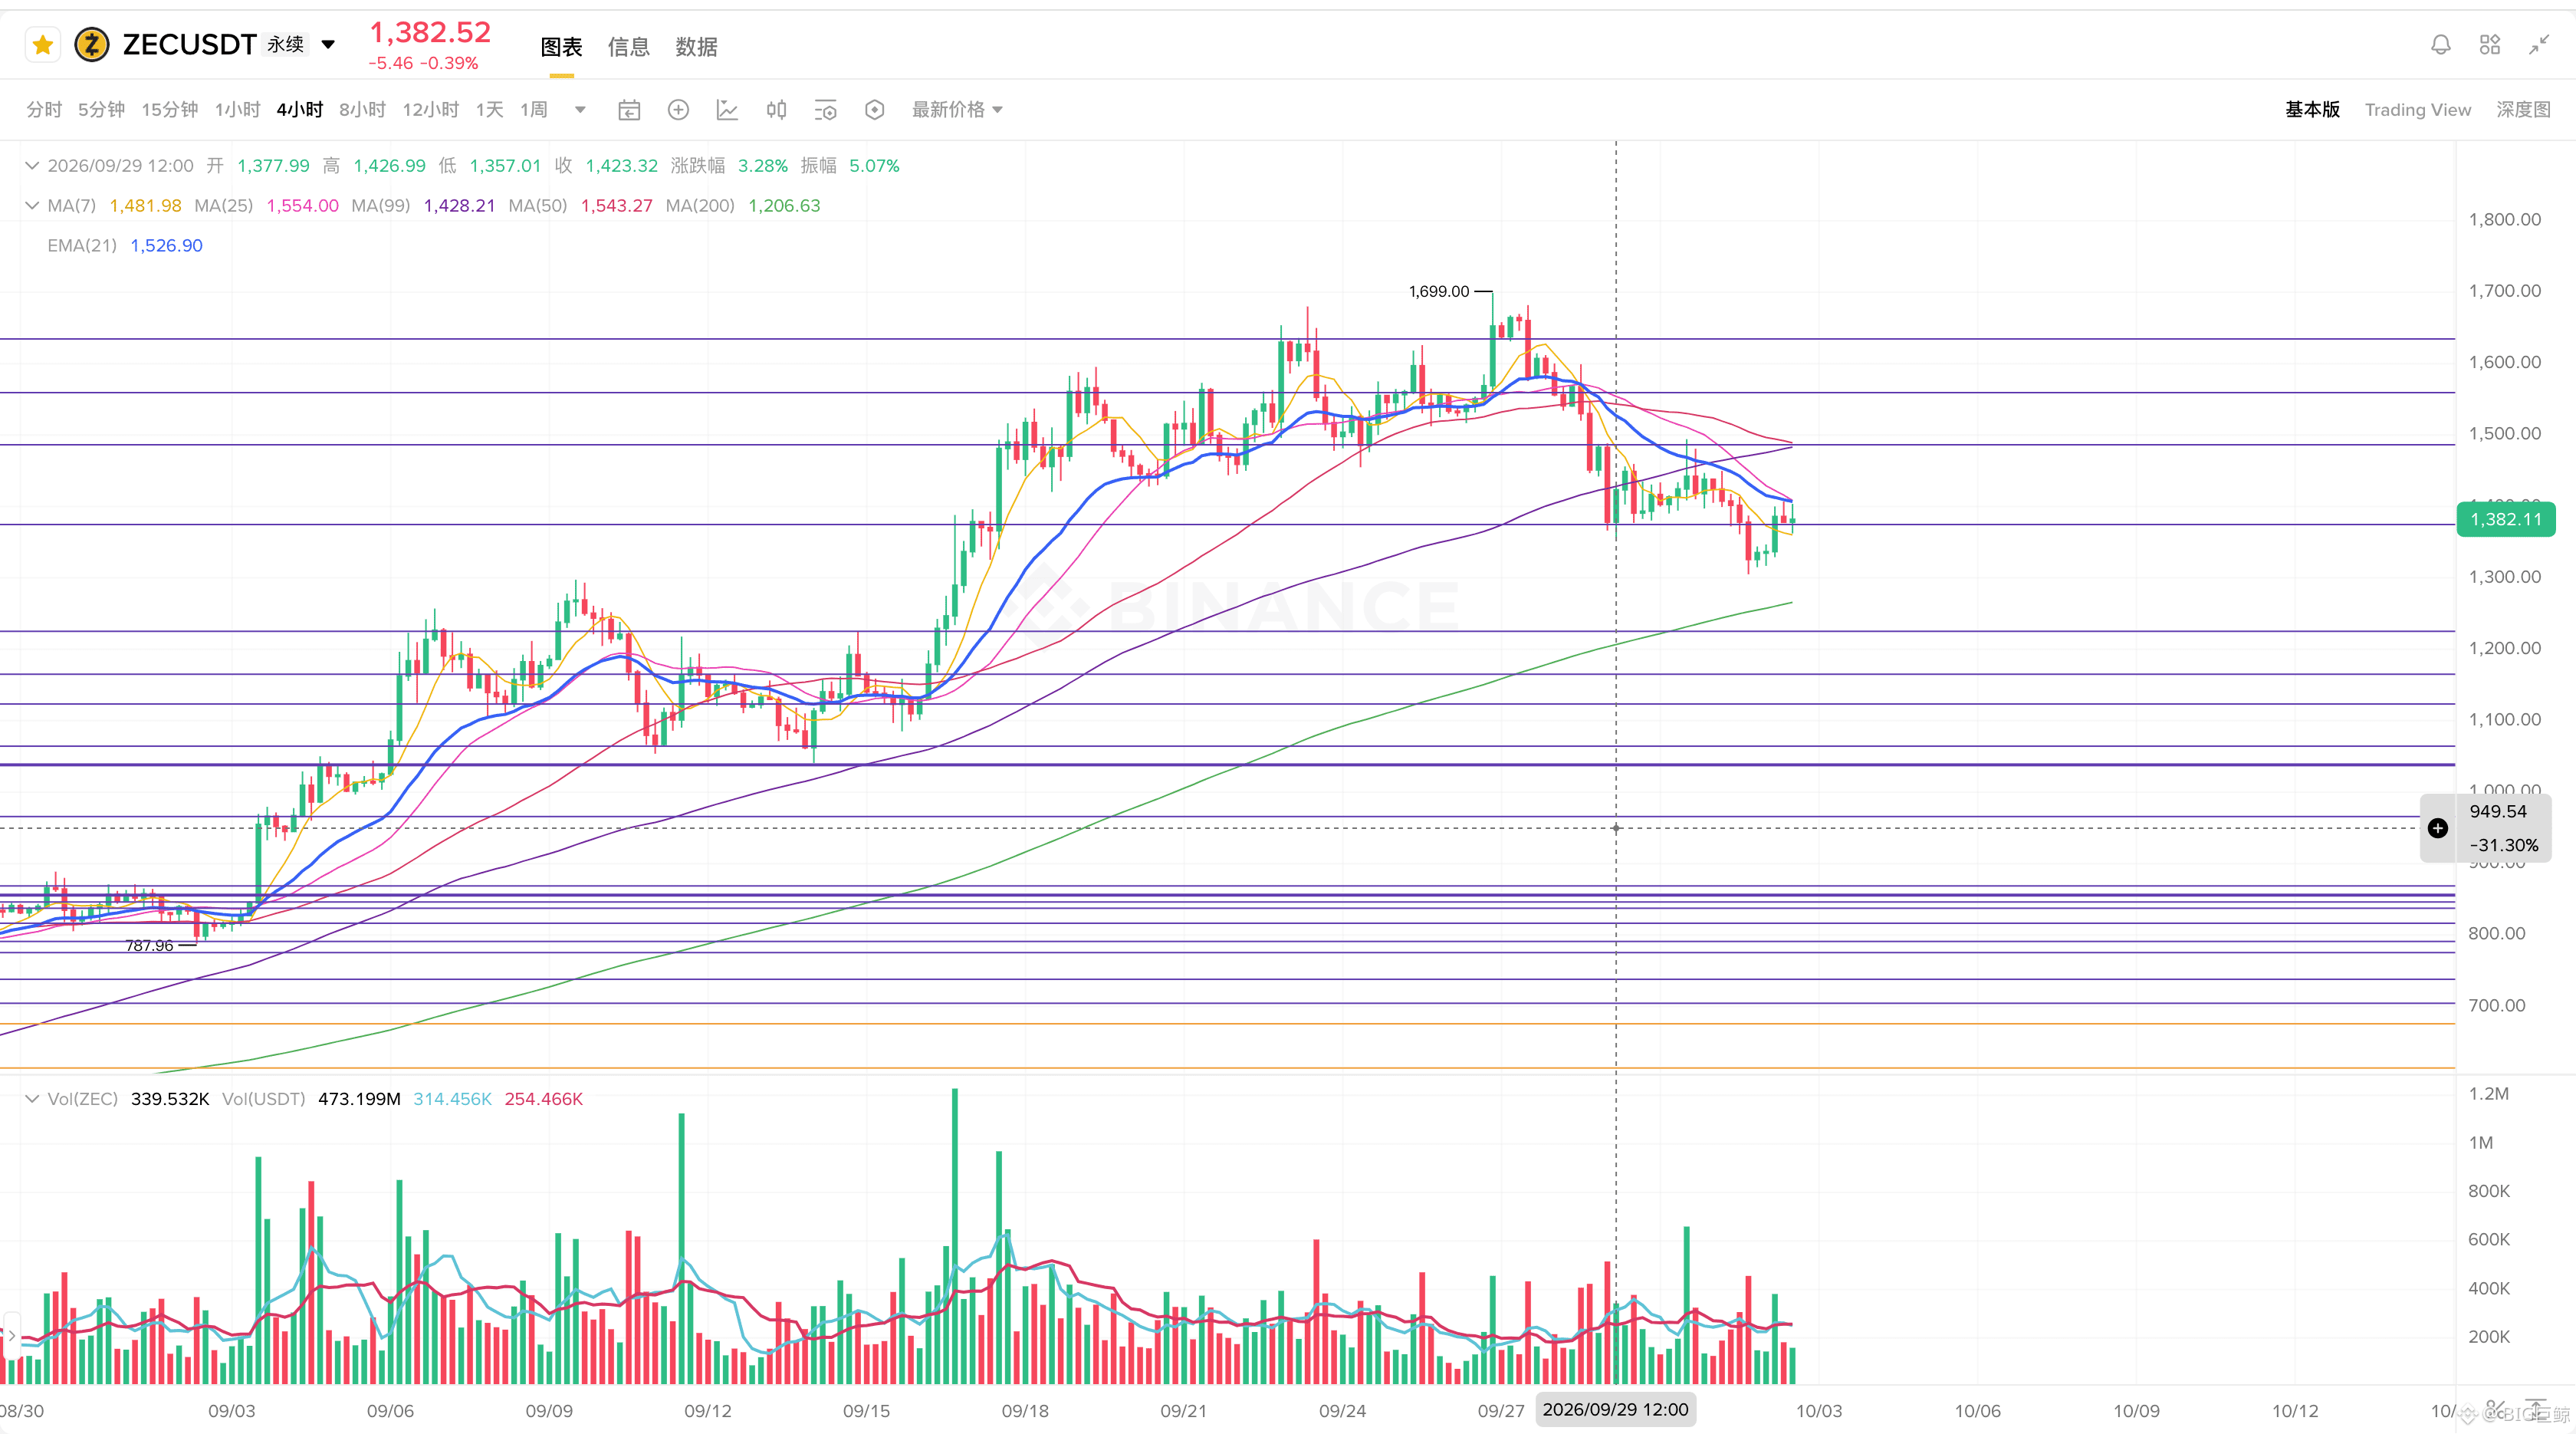
$ZEC From the September peak of about $1,698, it has fallen 21%—and is currently in a high-volatility consolidation/adjustment phase.
How to look at ZEC’s adjustment
**Previous high:** About $1,698 **
Recent low:** About $1,306 **
Maximum drawdown:** About 21% *
**September rally backdrop:**
Previously, it surged about 253% from around $481,
so the current pullback is also part of a deep shakeout after a strong trend.
**ETF factor:**
On September 30, the Grayscale Zcash ETF saw about a $30.25M net outflow, putting short-term capital flows under pressure.
**Technical outlook:**
It still cannot be simply defined as a trend reversal. The RSI has clearly cooled off from the previous overheated zone;
The 50-day EMA remains above the 200-day EMA.
Key levels
**Around $1,300:** Short-term first line of defense
**$1,233:** Important support; if the daily chart breaks below it, the adjustment could expand further
**$1,410:** Key level for a short-term return to strength
**$1,500:** Only after reclaiming it will there be a chance again to challenge $1,600–1,700
---------------
🐋 ZEC|Long opportunity after the pullback
ZEC is down about 21% from the September peak, and short-term price is entering a key support area.
Trading strategy:
🟢 After 1,370 stabilizes, go long
🛑 Stop loss: 1,338
🎯 Target 1: 1,480
🎯 Target 2: 1,555
Trading logic:
1. Near 1,370, if there is a stop-the-fall sign and volume picks up again, it indicates that buy-side demand is starting to absorb.
After breaking upward, first watch 1,480, then 1,555.
**Core confirmation:** 1,370 stabilizes + rebound volume increase.
⚠️ If it breaks below 1,338, the trading logic fails—strictly honor the stop loss.
👇👇👇【Click the trade below—your support is the motivation for my updates】👇👇👇🚀🚀🚀🌹🌹🌹
$ZEC From the September peak of about $1,698, it has fallen 21%—and is currently in a high-volatility consolidation/adjustment phase.
How to look at ZEC’s adjustment
**Previous high:** About $1,698 **
Recent low:** About $1,306 **
Maximum drawdown:** About 21% *
**September rally backdrop:**
Previously, it surged about 253% from around $481,
so the current pullback is also part of a deep shakeout after a strong trend.
**ETF factor:**
On September 30, the Grayscale Zcash ETF saw about a $30.25M net outflow, putting short-term capital flows under pressure.
**Technical outlook:**
It still cannot be simply defined as a trend reversal. The RSI has clearly cooled off from the previous overheated zone;
The 50-day EMA remains above the 200-day EMA.
Key levels
**Around $1,300:** Short-term first line of defense
**$1,233:** Important support; if the daily chart breaks below it, the adjustment could expand further
**$1,410:** Key level for a short-term return to strength
**$1,500:** Only after reclaiming it will there be a chance again to challenge $1,600–1,700
---------------
🐋 ZEC|Long opportunity after the pullback
ZEC is down about 21% from the September peak, and short-term price is entering a key support area.
Trading strategy:
🟢 After 1,370 stabilizes, go long
🛑 Stop loss: 1,338
🎯 Target 1: 1,480
🎯 Target 2: 1,555
Trading logic:
1. Near 1,370, if there is a stop-the-fall sign and volume picks up again, it indicates that buy-side demand is starting to absorb.
After breaking upward, first watch 1,480, then 1,555.
**Core confirmation:** 1,370 stabilizes + rebound volume increase.
⚠️ If it breaks below 1,338, the trading logic fails—strictly honor the stop loss.
👇👇👇【Click the trade below—your support is the motivation for my updates】👇👇👇🚀🚀🚀🌹🌹🌹