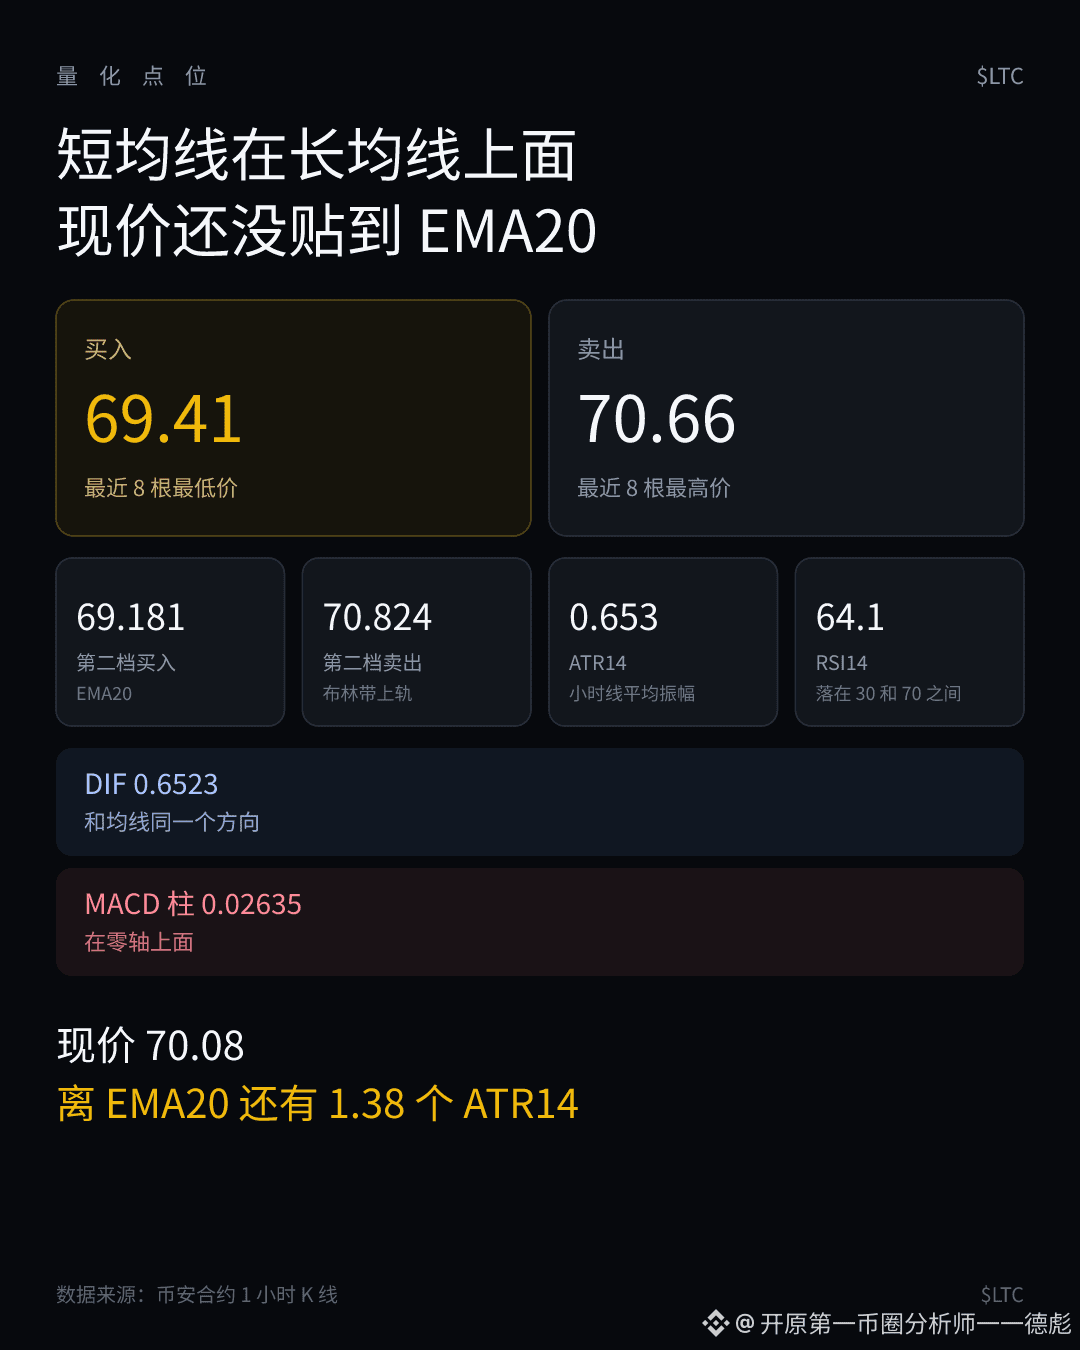
$LTC current price 70.08. For the hourly online chart, first look at the nearer sell orders.
- Buy 69.41
- Buy 69.181
- Sell 70.66
- Sell 70.824
Moving averages. The short moving average is above the long moving average. The current price is still 1.38 ATR14 away from the EMA20, and it has not touched it yet.
The nearer buy is the lowest price of the most recent 8 hourly candles; the next buy level is the EMA20.
The nearer sell is the highest price of the most recent 8 hourly candles; the farther sell is the upper band of the Bollinger Bands.
Momentum. Same direction as the moving averages. The MACD DIF 0.6523 is above the zero line. The histogram is 0.02635, also above the zero line, and it has not yet weakened.
Volatility. The average swing amplitude of this set of hourly candles is ATR14 0.653.
#LTC
- Buy 69.41
- Buy 69.181
- Sell 70.66
- Sell 70.824
Moving averages. The short moving average is above the long moving average. The current price is still 1.38 ATR14 away from the EMA20, and it has not touched it yet.
The nearer buy is the lowest price of the most recent 8 hourly candles; the next buy level is the EMA20.
The nearer sell is the highest price of the most recent 8 hourly candles; the farther sell is the upper band of the Bollinger Bands.
Momentum. Same direction as the moving averages. The MACD DIF 0.6523 is above the zero line. The histogram is 0.02635, also above the zero line, and it has not yet weakened.
Volatility. The average swing amplitude of this set of hourly candles is ATR14 0.653.
#LTC