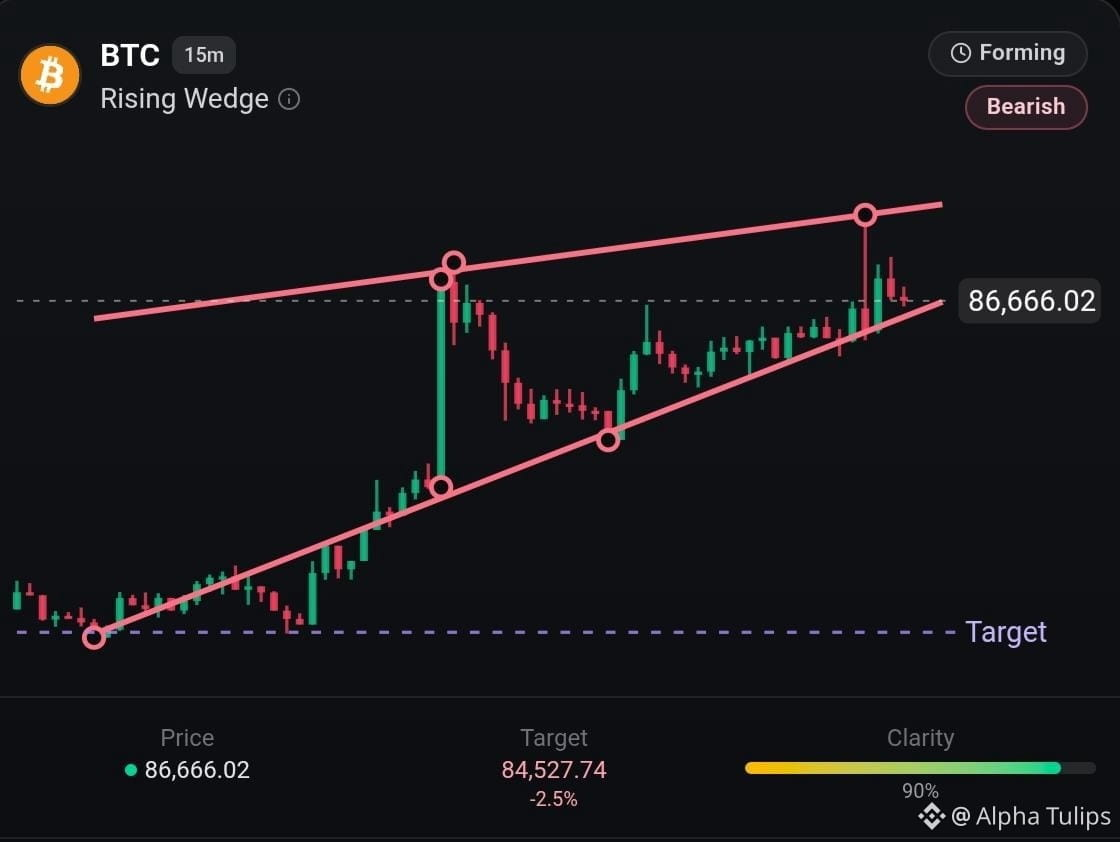
This chart shows that Bitcoin ($BTC ) is currently forming a "Rising Wedge" pattern on the 15-minute timeframe. The pattern is still in progress, indicating that the price is moving upward within a narrowing range as buying strength begins to fade.
Key levels
$87,220.00: The upper boundary of the current pattern where price momentum is struggling to break through.
$84,493.35: The lower support level that defines the bottom of the wedge.
$84,527.74: The identified target price should the pattern complete its expected downward move.
What to watch
The pattern is considered bearish, meaning there is a high likelihood the price will break downward as buyers lose momentum.
With a 90% clarity rating, the formation is well-defined, suggesting traders should monitor for a decisive move below the support levels.
Risk: The pattern is still forming, meaning the final direction is not yet confirmed.
Key levels
$87,220.00: The upper boundary of the current pattern where price momentum is struggling to break through.
$84,493.35: The lower support level that defines the bottom of the wedge.
$84,527.74: The identified target price should the pattern complete its expected downward move.
What to watch
The pattern is considered bearish, meaning there is a high likelihood the price will break downward as buyers lose momentum.
With a 90% clarity rating, the formation is well-defined, suggesting traders should monitor for a decisive move below the support levels.
Risk: The pattern is still forming, meaning the final direction is not yet confirmed.