Nasdaq is above the prior close—will BTC follow suit?
It’s easy to link the two lines when you look at the US stock market, then look again at BTC. I’ll watch them together too, but don’t rush to draw an equation.
In recent regular trading, the Nasdaq is around 26,871.60 points, up 0.04% from the previous trading day’s close. Over the past 24 hours, BTC perps are up 3.79%. Since these are two different windows, I’ll look at the direction separately first, without using the difference to decide who is outperforming.
When I look at the Nasdaq, I remind myself: an index is a basket of many companies, and it’s also affected by weighting. If a handful of large companies move strongly, the index can look better than most individual stocks. To judge whether overall risk appetite is really improving, you’d need to cross-check the number of advancing stocks, sector distribution, and how much the main weights are contributing. Right now, I only have the index quote, so I won’t fill in missing information with a narrative like “tech stocks have exploded across the board.” The index gives an entry point for observation; to know exactly who is pushing it, you need another layer of publicly available data.
There’s also a practical issue: the clocks for the Nasdaq and BTC aren’t aligned. US stocks have regular trading hours, while crypto prices move continuously. New information that appears after the US market closes may first show up in BTC’s price. That’s why I will show the quote times as well, and treat the data from closed hours explicitly as results of the most recent regular session. You can’t take one market’s finished trading day and another market’s still-moving window, then describe their reaction as if they happened simultaneously. Aligning the questions first is often more useful than rushing to interpret the color of the candles.
If the index keeps strengthening afterwards, I’ll see whether that strength is broadening—not just whether the index refreshes a number. A wider participation base makes it more suitable to continue discussing overall sentiment. If the rise is still concentrated in only a few weights, the explanation needs to be narrowed. BTC on the same side also needs its own price and trading evidence. When both sides look good at the same time, it can be a reason for further study—but without continuous observation, I won’t frame it as a stable transmission rule.
Finally, I have to leave some room for causality. Both can rise or fall together because of shared factors, or they can each have their own reasons. Simply having the same direction can’t prove that one market is driving the other. To make the explanation solid, you also need to look at the timing of news releases, whether the trend is continuous, and more public information. For this post, I’ll place the quotes that can be checked alongside the conditions that still need verification. I’d rather wait for new evidence to revise my view than rely on a smooth, ready-made story and skip over parts between the two markets that haven’t been confirmed.
Behind the Nasdaq is the business of a basket of companies, while BTC has its own supply and demand. After the US market sends a positive signal, I would be more willing to keep following this line if BTC can also hold its own range highs. If BTC keeps turning weaker, you can’t always use the US market as a justification for it.
It’s worth watching when both sides move in the same direction. But when they start to diverge, that might be where the real interest lies.
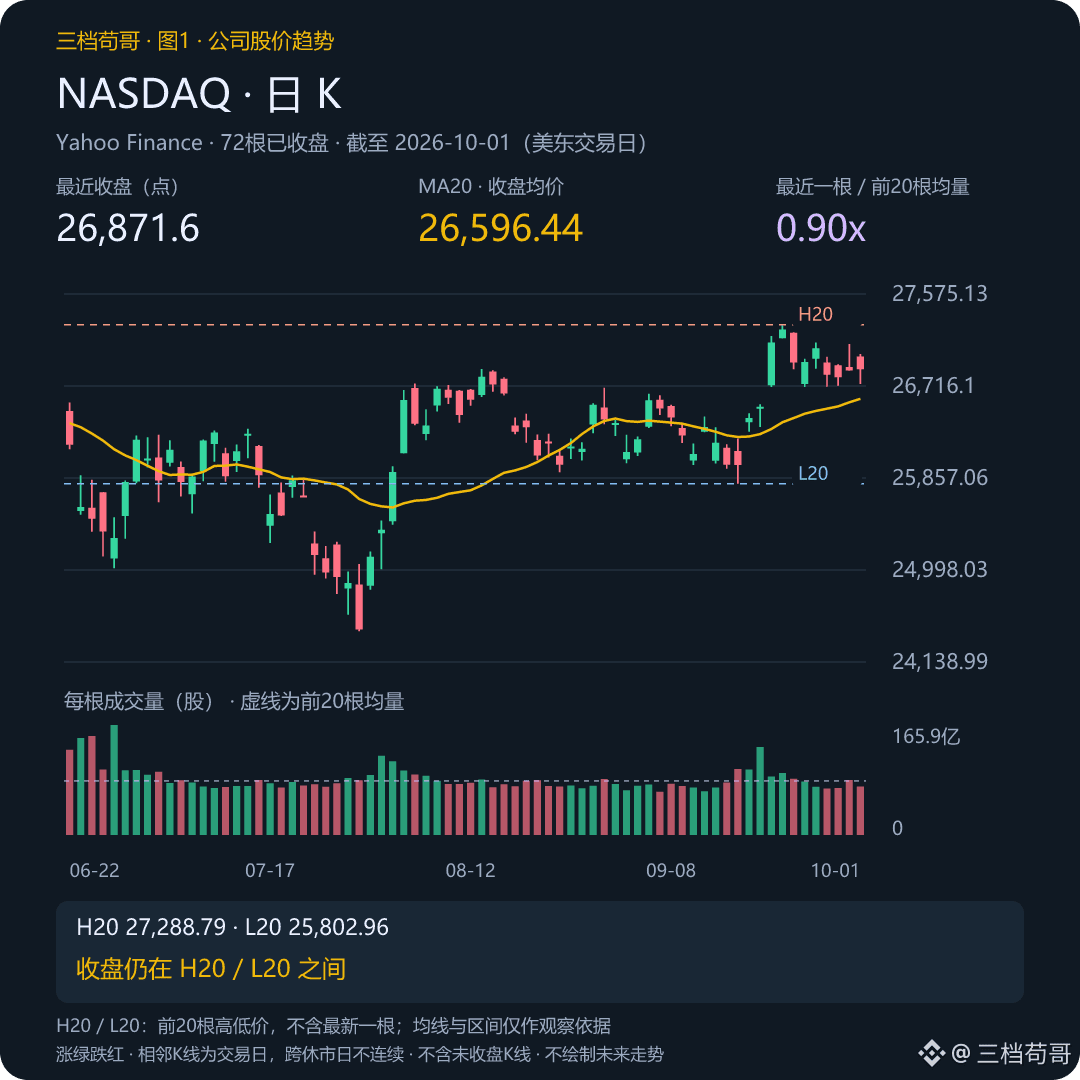
Look at Figure 1: Nasdaq daily K (latest closed trading day 2026-10-01, US Eastern time). The close is still within the high-low range of the previous 20 candles: 25,802.96–27,288.79. This close is also above the MA20. The volume of this candle is 0.90 times the average volume of the prior 20 candles, close to the recent normal. For now, I treat it as movement within the range, and I’m waiting to see which side is truly broken through on the close. H20/L20 does not include the latest candle; it’s only a range observation line, not a confirmed support or resistance.
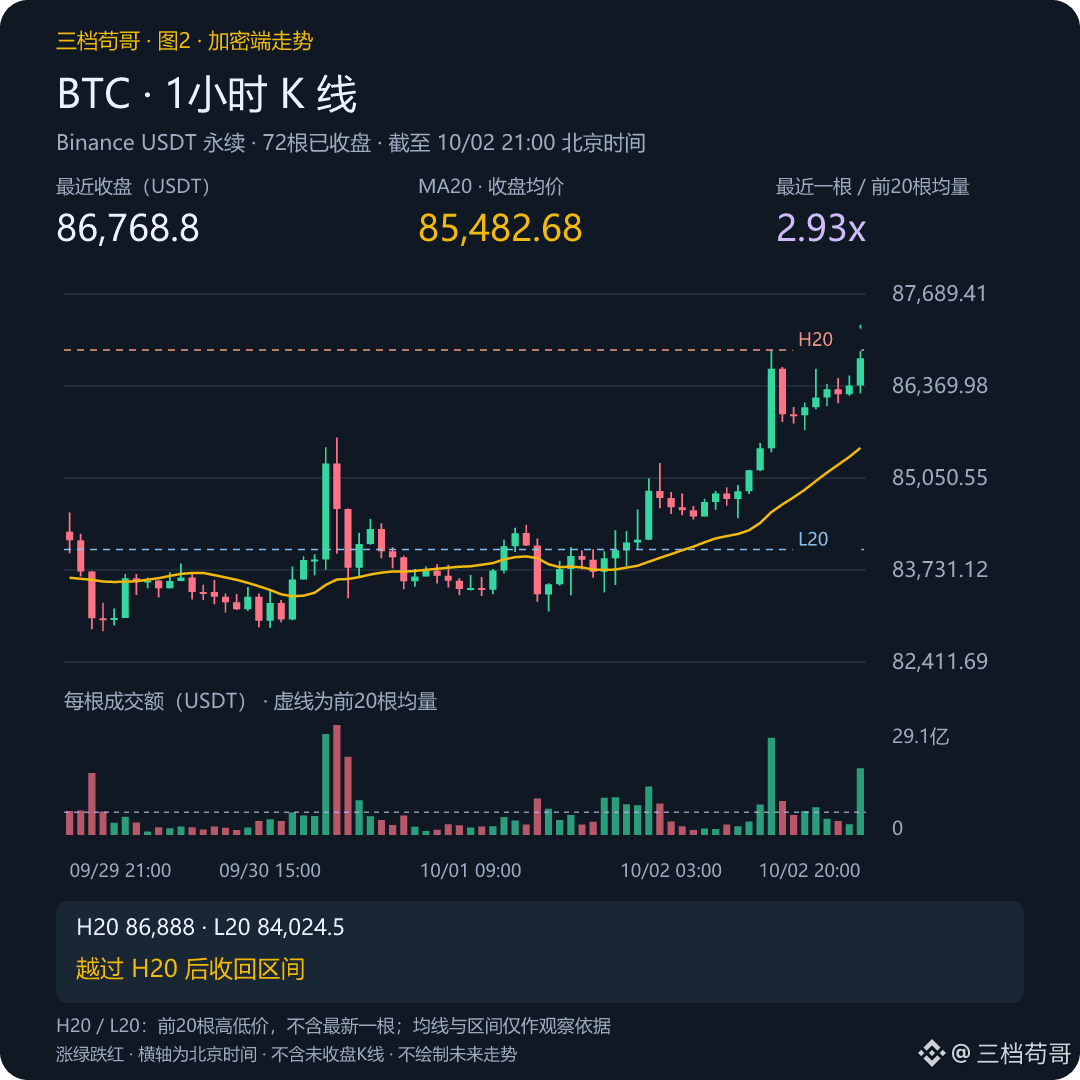
Look at Figure 2: BTC 1-hour K line (as of 21:00:00 Beijing time). During the session, it broke above the highs of the prior 20 candles at 86,888, but the close has fallen back below that line. This close is also above the MA20. The volume of this candle is 2.93 times the average volume of the prior 20 candles, more active than the recent normal. This breakout hasn’t held through on the close yet, so it’s a bit more cautious than only looking at the highest price. H20/L20 does not include the latest candle; it’s only a range observation line, not a confirmed support or resistance.
I’ll keep the conditions above and then see whether the BTC price action provides an answer. You can check the coin entry points below.
Source: Yahoo Finance—US stock market quotes 2026/10/2 05:15:59; Binance USDT perps 2026/10/2 21:03:08 (Beijing time). The US stock market provides real market quotes, not tokenized stocks.
For discussion only; not investment advice.
$BTC $ETH $MAGMA
It’s easy to link the two lines when you look at the US stock market, then look again at BTC. I’ll watch them together too, but don’t rush to draw an equation.
In recent regular trading, the Nasdaq is around 26,871.60 points, up 0.04% from the previous trading day’s close. Over the past 24 hours, BTC perps are up 3.79%. Since these are two different windows, I’ll look at the direction separately first, without using the difference to decide who is outperforming.
When I look at the Nasdaq, I remind myself: an index is a basket of many companies, and it’s also affected by weighting. If a handful of large companies move strongly, the index can look better than most individual stocks. To judge whether overall risk appetite is really improving, you’d need to cross-check the number of advancing stocks, sector distribution, and how much the main weights are contributing. Right now, I only have the index quote, so I won’t fill in missing information with a narrative like “tech stocks have exploded across the board.” The index gives an entry point for observation; to know exactly who is pushing it, you need another layer of publicly available data.
There’s also a practical issue: the clocks for the Nasdaq and BTC aren’t aligned. US stocks have regular trading hours, while crypto prices move continuously. New information that appears after the US market closes may first show up in BTC’s price. That’s why I will show the quote times as well, and treat the data from closed hours explicitly as results of the most recent regular session. You can’t take one market’s finished trading day and another market’s still-moving window, then describe their reaction as if they happened simultaneously. Aligning the questions first is often more useful than rushing to interpret the color of the candles.
If the index keeps strengthening afterwards, I’ll see whether that strength is broadening—not just whether the index refreshes a number. A wider participation base makes it more suitable to continue discussing overall sentiment. If the rise is still concentrated in only a few weights, the explanation needs to be narrowed. BTC on the same side also needs its own price and trading evidence. When both sides look good at the same time, it can be a reason for further study—but without continuous observation, I won’t frame it as a stable transmission rule.
Finally, I have to leave some room for causality. Both can rise or fall together because of shared factors, or they can each have their own reasons. Simply having the same direction can’t prove that one market is driving the other. To make the explanation solid, you also need to look at the timing of news releases, whether the trend is continuous, and more public information. For this post, I’ll place the quotes that can be checked alongside the conditions that still need verification. I’d rather wait for new evidence to revise my view than rely on a smooth, ready-made story and skip over parts between the two markets that haven’t been confirmed.
Behind the Nasdaq is the business of a basket of companies, while BTC has its own supply and demand. After the US market sends a positive signal, I would be more willing to keep following this line if BTC can also hold its own range highs. If BTC keeps turning weaker, you can’t always use the US market as a justification for it.
It’s worth watching when both sides move in the same direction. But when they start to diverge, that might be where the real interest lies.
Look at Figure 1: Nasdaq daily K (latest closed trading day 2026-10-01, US Eastern time). The close is still within the high-low range of the previous 20 candles: 25,802.96–27,288.79. This close is also above the MA20. The volume of this candle is 0.90 times the average volume of the prior 20 candles, close to the recent normal. For now, I treat it as movement within the range, and I’m waiting to see which side is truly broken through on the close. H20/L20 does not include the latest candle; it’s only a range observation line, not a confirmed support or resistance.
Look at Figure 2: BTC 1-hour K line (as of 21:00:00 Beijing time). During the session, it broke above the highs of the prior 20 candles at 86,888, but the close has fallen back below that line. This close is also above the MA20. The volume of this candle is 2.93 times the average volume of the prior 20 candles, more active than the recent normal. This breakout hasn’t held through on the close yet, so it’s a bit more cautious than only looking at the highest price. H20/L20 does not include the latest candle; it’s only a range observation line, not a confirmed support or resistance.
I’ll keep the conditions above and then see whether the BTC price action provides an answer. You can check the coin entry points below.
Source: Yahoo Finance—US stock market quotes 2026/10/2 05:15:59; Binance USDT perps 2026/10/2 21:03:08 (Beijing time). The US stock market provides real market quotes, not tokenized stocks.
For discussion only; not investment advice.
$BTC $ETH $MAGMA