$ETH This move is a bit interesting— the data is contradicting itself.
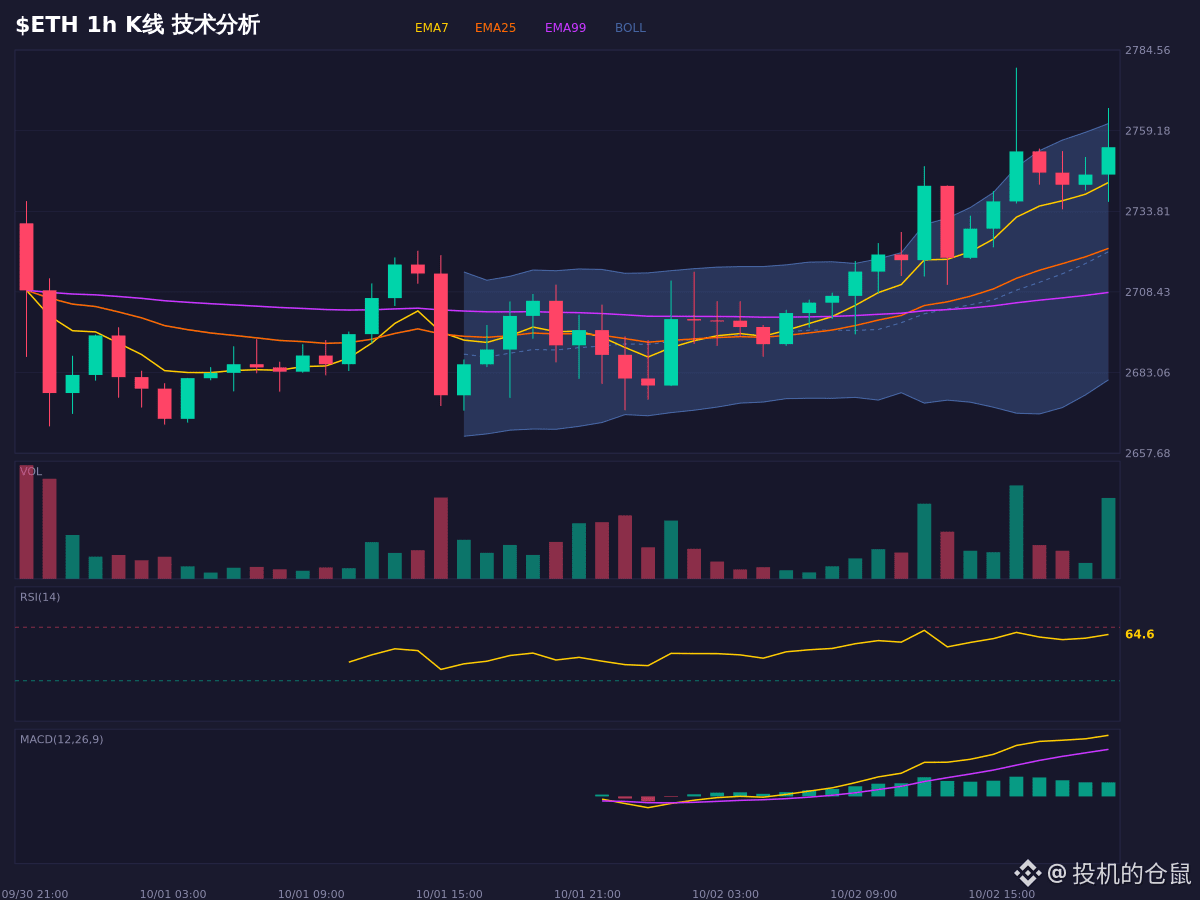
The daily K (日K) is trading above EMA7/25/99, and the long positions are pretty stable with a bullish alignment. However, RSI shows a top bearish divergence, and Stoch RSI has a dead cross, making the short-term outlook a bit risky. Price is above the Bollinger Band middle line, with a bandwidth of 2.97%, so volatility is acceptable.
Support is at 2725–2737, where the Fib retracement and EMA25 resonate. Resistance levels are 2773 and 2809, referencing the prior high and 1.5× ATR.
If price holds and stays above 2725, the bullish structure may continue; if it breaks below 2702, the logic fails. Only observe—no trading.
$ETH #合约 #市场情绪 #Market analysis
The daily K (日K) is trading above EMA7/25/99, and the long positions are pretty stable with a bullish alignment. However, RSI shows a top bearish divergence, and Stoch RSI has a dead cross, making the short-term outlook a bit risky. Price is above the Bollinger Band middle line, with a bandwidth of 2.97%, so volatility is acceptable.
Support is at 2725–2737, where the Fib retracement and EMA25 resonate. Resistance levels are 2773 and 2809, referencing the prior high and 1.5× ATR.
If price holds and stays above 2725, the bullish structure may continue; if it breaks below 2702, the logic fails. Only observe—no trading.
$ETH #合约 #市场情绪 #Market analysis