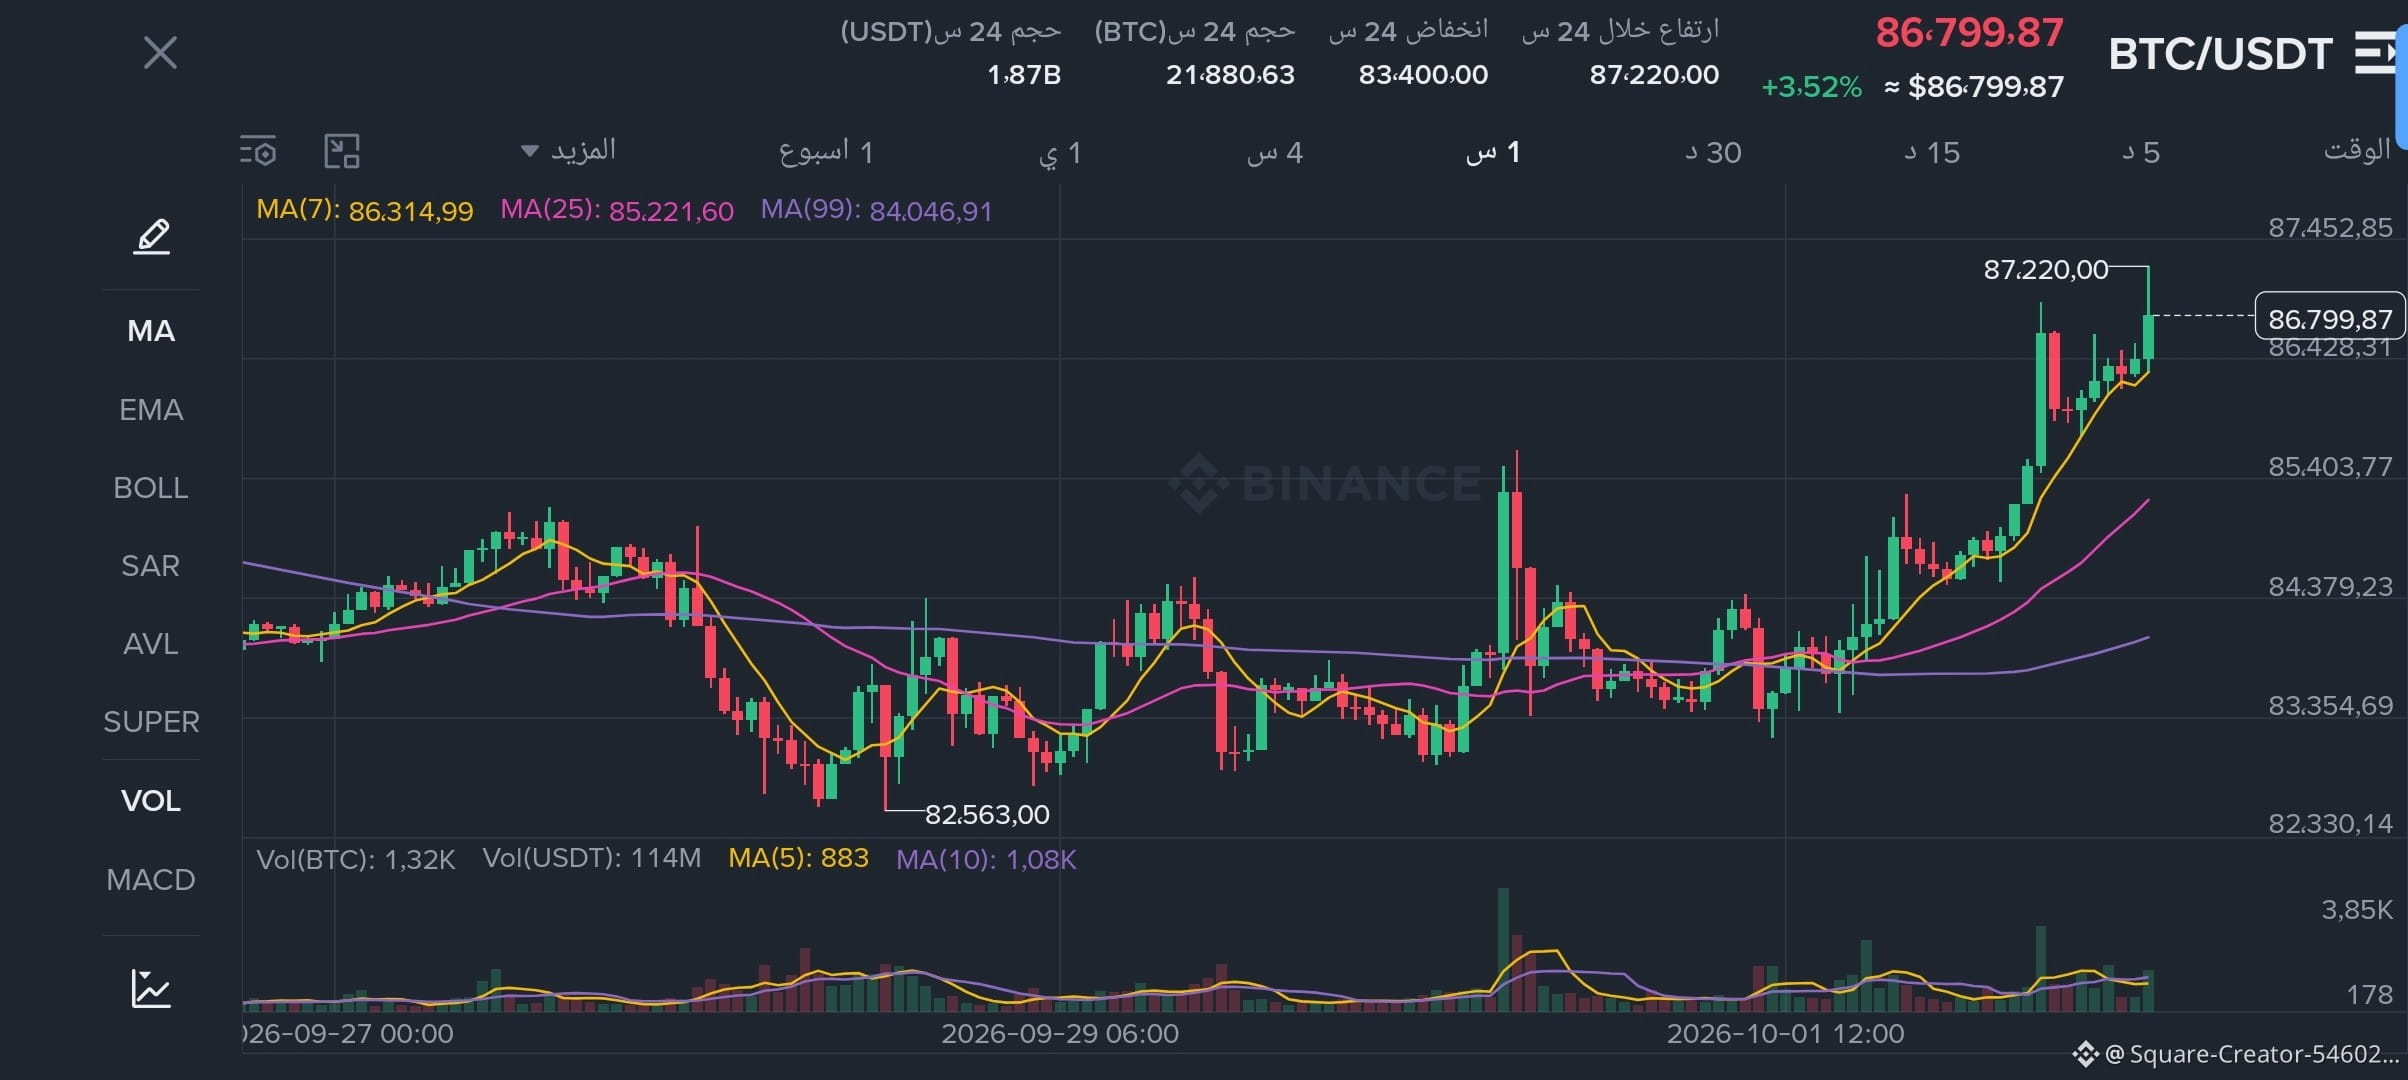
🧠 A rising trap or a breakout to $90,000? The truth behind the $1.87 billion liquidity pool on $BTC right now!
Stop making random buys and read the 1-hour chart accurately before you make your decision:
📊 1️⃣ Liquidity figures and sensitive levels:
• Price is strongly pressing at $86,799 (up +3.52%).
• A massive liquidity inflow exceeding 1.87 billion USDT and trading over 21,880 BTC within 24 hours!
• Price hit the immediate top at $87,220 and is consolidating above the MA(7) at $86,314.
💡 2️⃣ Market makers’ scenario (Smart Money):
We are now facing one of two scenarios—there is no third:
🟢 Scenario one: A close of the 1-hour candle above $87,220 means short positions get liquidated and a direct move toward $89,500 - $90,000 begins.
🔴 Scenario two: A bounce from this level means a retest of the support zones at $85,200.
👉 Check the order book and the depth of the immediate liquidity yourself right now:
Click on $BTC to preview the current candle movement and the strength of buying power before the break! ⏱️⚡
💬 Vote in the comments with a number:
1️⃣ Break of $87,220 and a run to $90k today.
2️⃣ Drop and correction to $85k first.
#Write2Earn #BTC #CryptoAnalysis $BNB
Stop making random buys and read the 1-hour chart accurately before you make your decision:
📊 1️⃣ Liquidity figures and sensitive levels:
• Price is strongly pressing at $86,799 (up +3.52%).
• A massive liquidity inflow exceeding 1.87 billion USDT and trading over 21,880 BTC within 24 hours!
• Price hit the immediate top at $87,220 and is consolidating above the MA(7) at $86,314.
💡 2️⃣ Market makers’ scenario (Smart Money):
We are now facing one of two scenarios—there is no third:
🟢 Scenario one: A close of the 1-hour candle above $87,220 means short positions get liquidated and a direct move toward $89,500 - $90,000 begins.
🔴 Scenario two: A bounce from this level means a retest of the support zones at $85,200.
👉 Check the order book and the depth of the immediate liquidity yourself right now:
Click on $BTC to preview the current candle movement and the strength of buying power before the break! ⏱️⚡
💬 Vote in the comments with a number:
1️⃣ Break of $87,220 and a run to $90k today.
2️⃣ Drop and correction to $85k first.
#Write2Earn #BTC #CryptoAnalysis $BNB