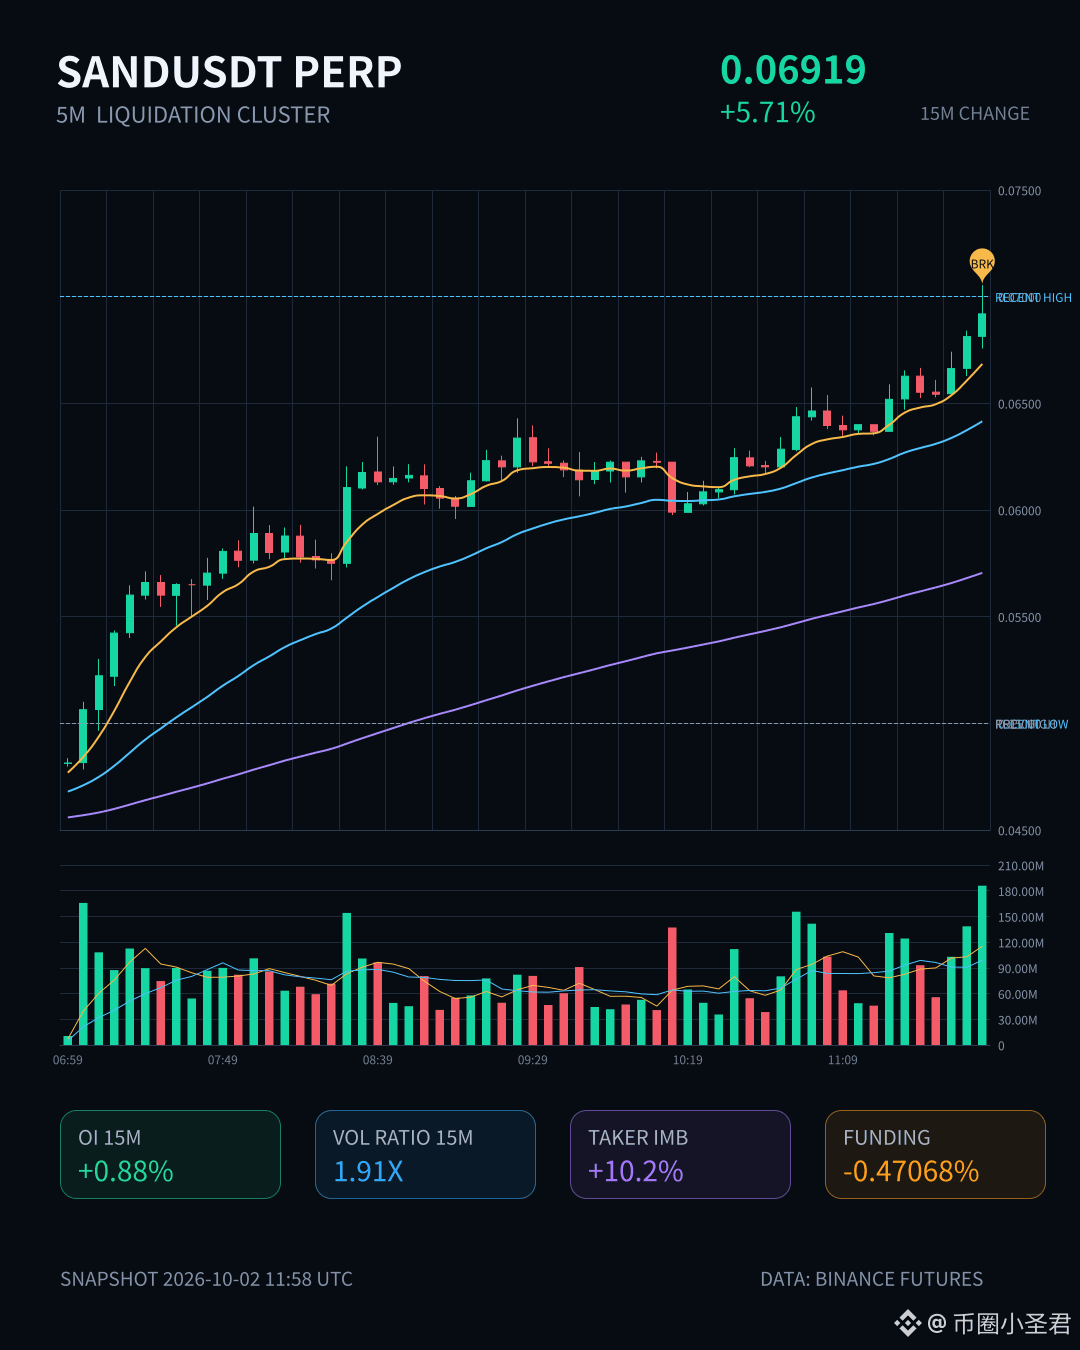
$SAND In these 15 minutes, it’s up 5.71%, and the turnover has also risen to 1.91x—not that kind of push-a-single-candle-then-fizzle trading style.
Looking at OI changes is even more interesting—+7.95% in the past hour, with a nominal increase of 3.64M. Over the last 15 minutes it’s still continuing, with a net add of 1.66M. Price rising alongside ongoing accumulation of open positions: this picture is very typical—this isn’t a spike after short liquidation panic, but a batch-by-batch entry of fresh longs, using leverage to build.
Funding rates have already climbed into the high end of the recent range: 98% anomalous percentile—top three across the whole pool, and sustained across multiple consecutive periods. The market structure tells me the capital behind this round of adding isn’t just randomly messing around with spot orders.
Passive match is down 10.2%, buy/sell ratio 1.23. On Binance, liquidations at around 212K are happening on the 5m chart, but the buying side is more concentrated—suggesting the liquidations are mostly shorts getting squeezed, while longs push upward using liquidation as fuel. 24h trading volume is 265M; liquidity depth is sufficient. Volume is higher than normal, and the price is just touching the boundary of the recent range.
This kind of structure is most likely to fall into a self-reinforcing loop: squeeze shorts, funding rates rise, attract more follower leverage, then push again. But conversely, once leverage density gets to this level, if price starts to go sideways or reverses, a chain of deleveraging could be more violent than the rally. My current view—don’t chase the highs. Focus on when this OI surge stops growing; that’s usually the turning-point signal.
$SAND
Looking at OI changes is even more interesting—+7.95% in the past hour, with a nominal increase of 3.64M. Over the last 15 minutes it’s still continuing, with a net add of 1.66M. Price rising alongside ongoing accumulation of open positions: this picture is very typical—this isn’t a spike after short liquidation panic, but a batch-by-batch entry of fresh longs, using leverage to build.
Funding rates have already climbed into the high end of the recent range: 98% anomalous percentile—top three across the whole pool, and sustained across multiple consecutive periods. The market structure tells me the capital behind this round of adding isn’t just randomly messing around with spot orders.
Passive match is down 10.2%, buy/sell ratio 1.23. On Binance, liquidations at around 212K are happening on the 5m chart, but the buying side is more concentrated—suggesting the liquidations are mostly shorts getting squeezed, while longs push upward using liquidation as fuel. 24h trading volume is 265M; liquidity depth is sufficient. Volume is higher than normal, and the price is just touching the boundary of the recent range.
This kind of structure is most likely to fall into a self-reinforcing loop: squeeze shorts, funding rates rise, attract more follower leverage, then push again. But conversely, once leverage density gets to this level, if price starts to go sideways or reverses, a chain of deleveraging could be more violent than the rally. My current view—don’t chase the highs. Focus on when this OI surge stops growing; that’s usually the turning-point signal.
$SAND