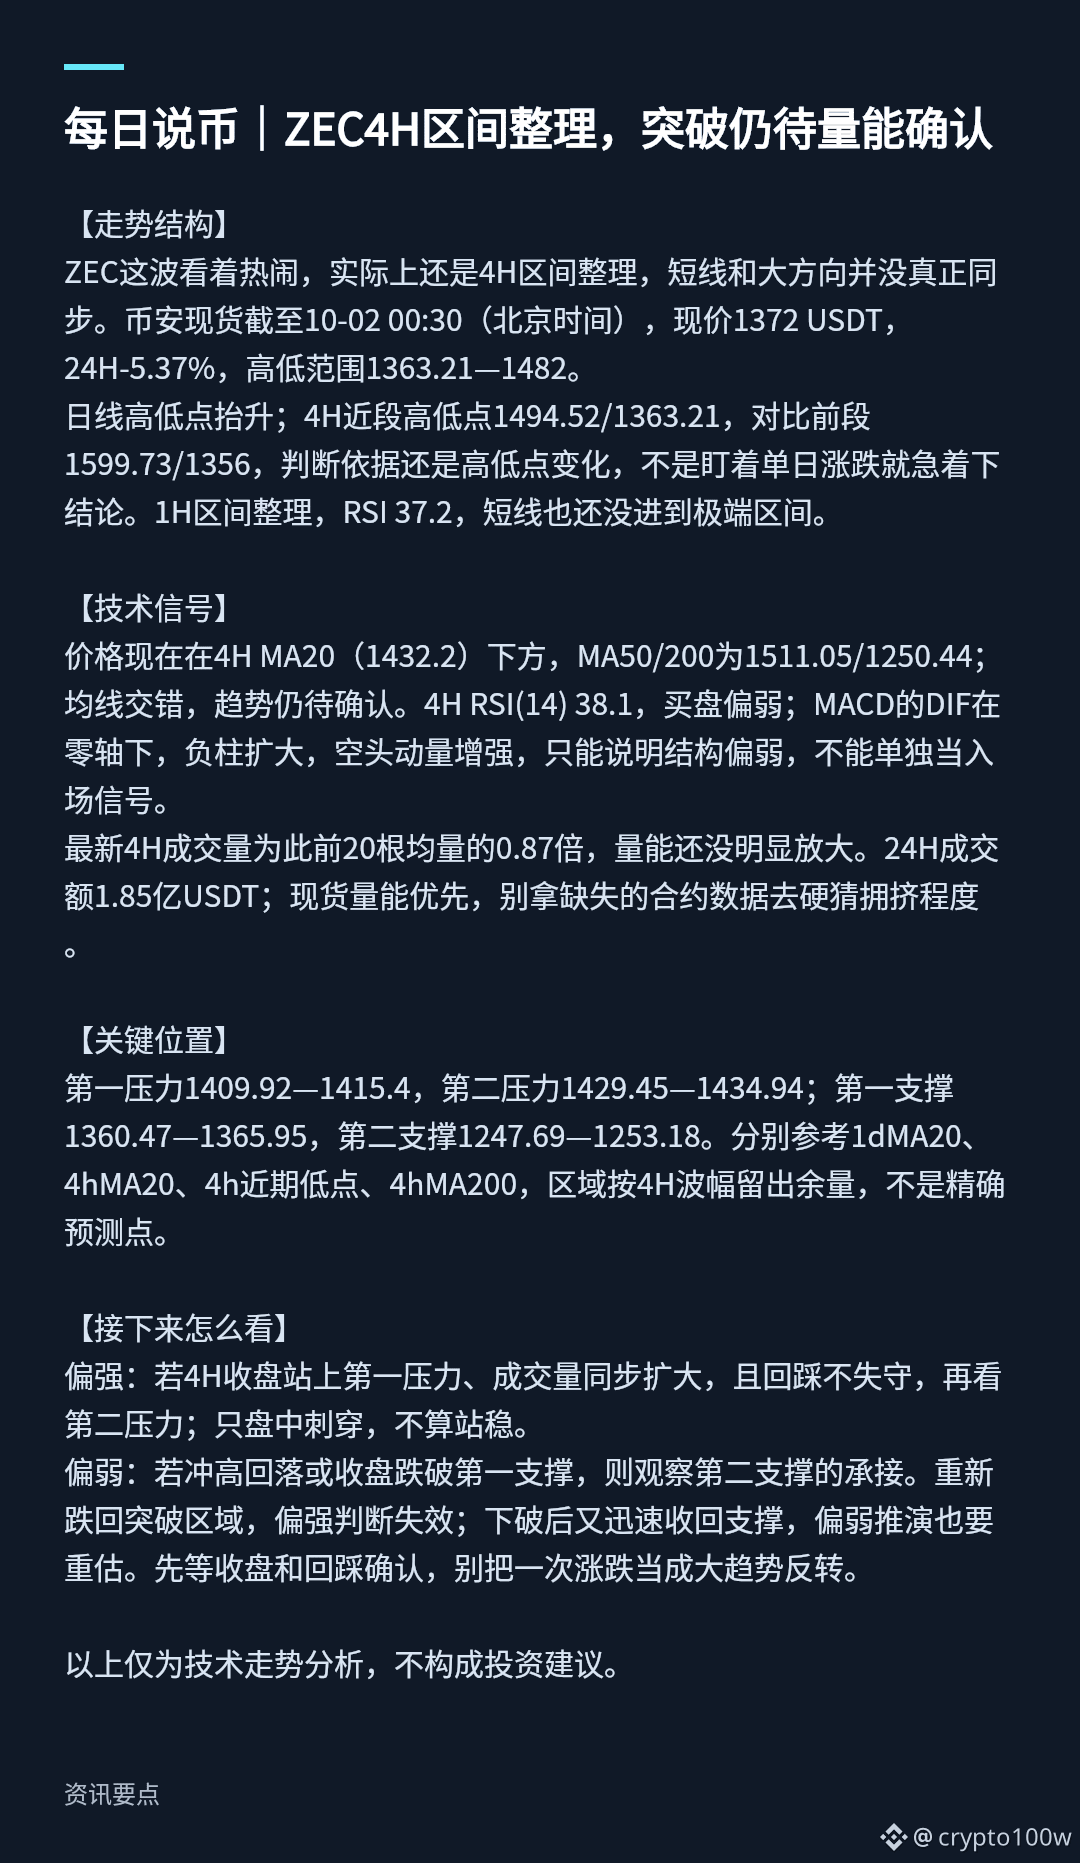
[Market Structure]
ZEC’s move looks lively, but it’s still basically consolidation within the 4H range. The short-term and the bigger directional picture haven’t truly aligned yet. Binance spot as of 10-02 00:30 (Beijing time): current price 1372 USDT; 24H change -5.37%, trading range 1363.21—1482.
Daily swing high/low points are rising; in the 4H timeframe, the recent swing high/low are 1494.52/1363.21. Compared with the prior segment 1599.73/1356, the 판단 still relies on the changes in swing highs and lows—not on obsessing over one day’s up/down to jump to conclusions. The 1H is consolidating; RSI is 37.2, and the short-term has not entered an extreme zone yet.
[Technical Signals]
Price is currently below the 4H MA20 (1432.2). MA50/200 are 1511.05/1250.44. The moving averages are interwoven, so the trend still needs confirmation. 4H RSI(14) is 38.1, with relatively weak buying pressure. In the MACD, the DIF is below the zero line and the negative histogram bars are expanding, indicating stronger bearish momentum. This only suggests the structure is weak; it cannot be used alone as an entry signal.
The latest 4H traded volume is 0.87x the average volume of the prior 20 bars—volume hasn’t clearly increased yet. 24H turnover is 185 million USDT. Spot volume capacity should be prioritized; don’t make hard guesses about crowding based on missing futures data.
[Key Levels]
First resistance: 1409.92—1415.4. Second resistance: 1429.45—1434.94. First support: 1360.47—1365.95. Second support: 1247.69—1253.18. Refer to 1d MA20, 4h MA20, the recent 4h swing lows, and the 4h MA200 respectively. Leave some buffer based on the 4H swing range; these are not precise target points.
[How to Look Next]
More bullish: If the 4H close is above the first resistance with a synchronized increase in volume, and the subsequent pullback does not break down, then watch the second resistance. If it only spikes through during the intraday and doesn’t hold, it doesn’t count as established.
More bearish: If it rallies then falls back, or the 4H close breaks below the first support, then watch how it holds at the second support. If price drops back into the breakout area, the bullish thesis fails. After a breakdown, if it quickly reclaims the support, then the bearish scenario also needs to be reassessed. Wait for the close and confirmation via a pullback—don’t treat one up/down move as a full trend reversal.
The above is only an analysis of technical走势 and does not constitute investment advice.
ZEC’s move looks lively, but it’s still basically consolidation within the 4H range. The short-term and the bigger directional picture haven’t truly aligned yet. Binance spot as of 10-02 00:30 (Beijing time): current price 1372 USDT; 24H change -5.37%, trading range 1363.21—1482.
Daily swing high/low points are rising; in the 4H timeframe, the recent swing high/low are 1494.52/1363.21. Compared with the prior segment 1599.73/1356, the 판단 still relies on the changes in swing highs and lows—not on obsessing over one day’s up/down to jump to conclusions. The 1H is consolidating; RSI is 37.2, and the short-term has not entered an extreme zone yet.
[Technical Signals]
Price is currently below the 4H MA20 (1432.2). MA50/200 are 1511.05/1250.44. The moving averages are interwoven, so the trend still needs confirmation. 4H RSI(14) is 38.1, with relatively weak buying pressure. In the MACD, the DIF is below the zero line and the negative histogram bars are expanding, indicating stronger bearish momentum. This only suggests the structure is weak; it cannot be used alone as an entry signal.
The latest 4H traded volume is 0.87x the average volume of the prior 20 bars—volume hasn’t clearly increased yet. 24H turnover is 185 million USDT. Spot volume capacity should be prioritized; don’t make hard guesses about crowding based on missing futures data.
[Key Levels]
First resistance: 1409.92—1415.4. Second resistance: 1429.45—1434.94. First support: 1360.47—1365.95. Second support: 1247.69—1253.18. Refer to 1d MA20, 4h MA20, the recent 4h swing lows, and the 4h MA200 respectively. Leave some buffer based on the 4H swing range; these are not precise target points.
[How to Look Next]
More bullish: If the 4H close is above the first resistance with a synchronized increase in volume, and the subsequent pullback does not break down, then watch the second resistance. If it only spikes through during the intraday and doesn’t hold, it doesn’t count as established.
More bearish: If it rallies then falls back, or the 4H close breaks below the first support, then watch how it holds at the second support. If price drops back into the breakout area, the bullish thesis fails. After a breakdown, if it quickly reclaims the support, then the bearish scenario also needs to be reassessed. Wait for the close and confirmation via a pullback—don’t treat one up/down move as a full trend reversal.
The above is only an analysis of technical走势 and does not constitute investment advice.