Alright, class, let's take a good look at this $SAND
chart together.
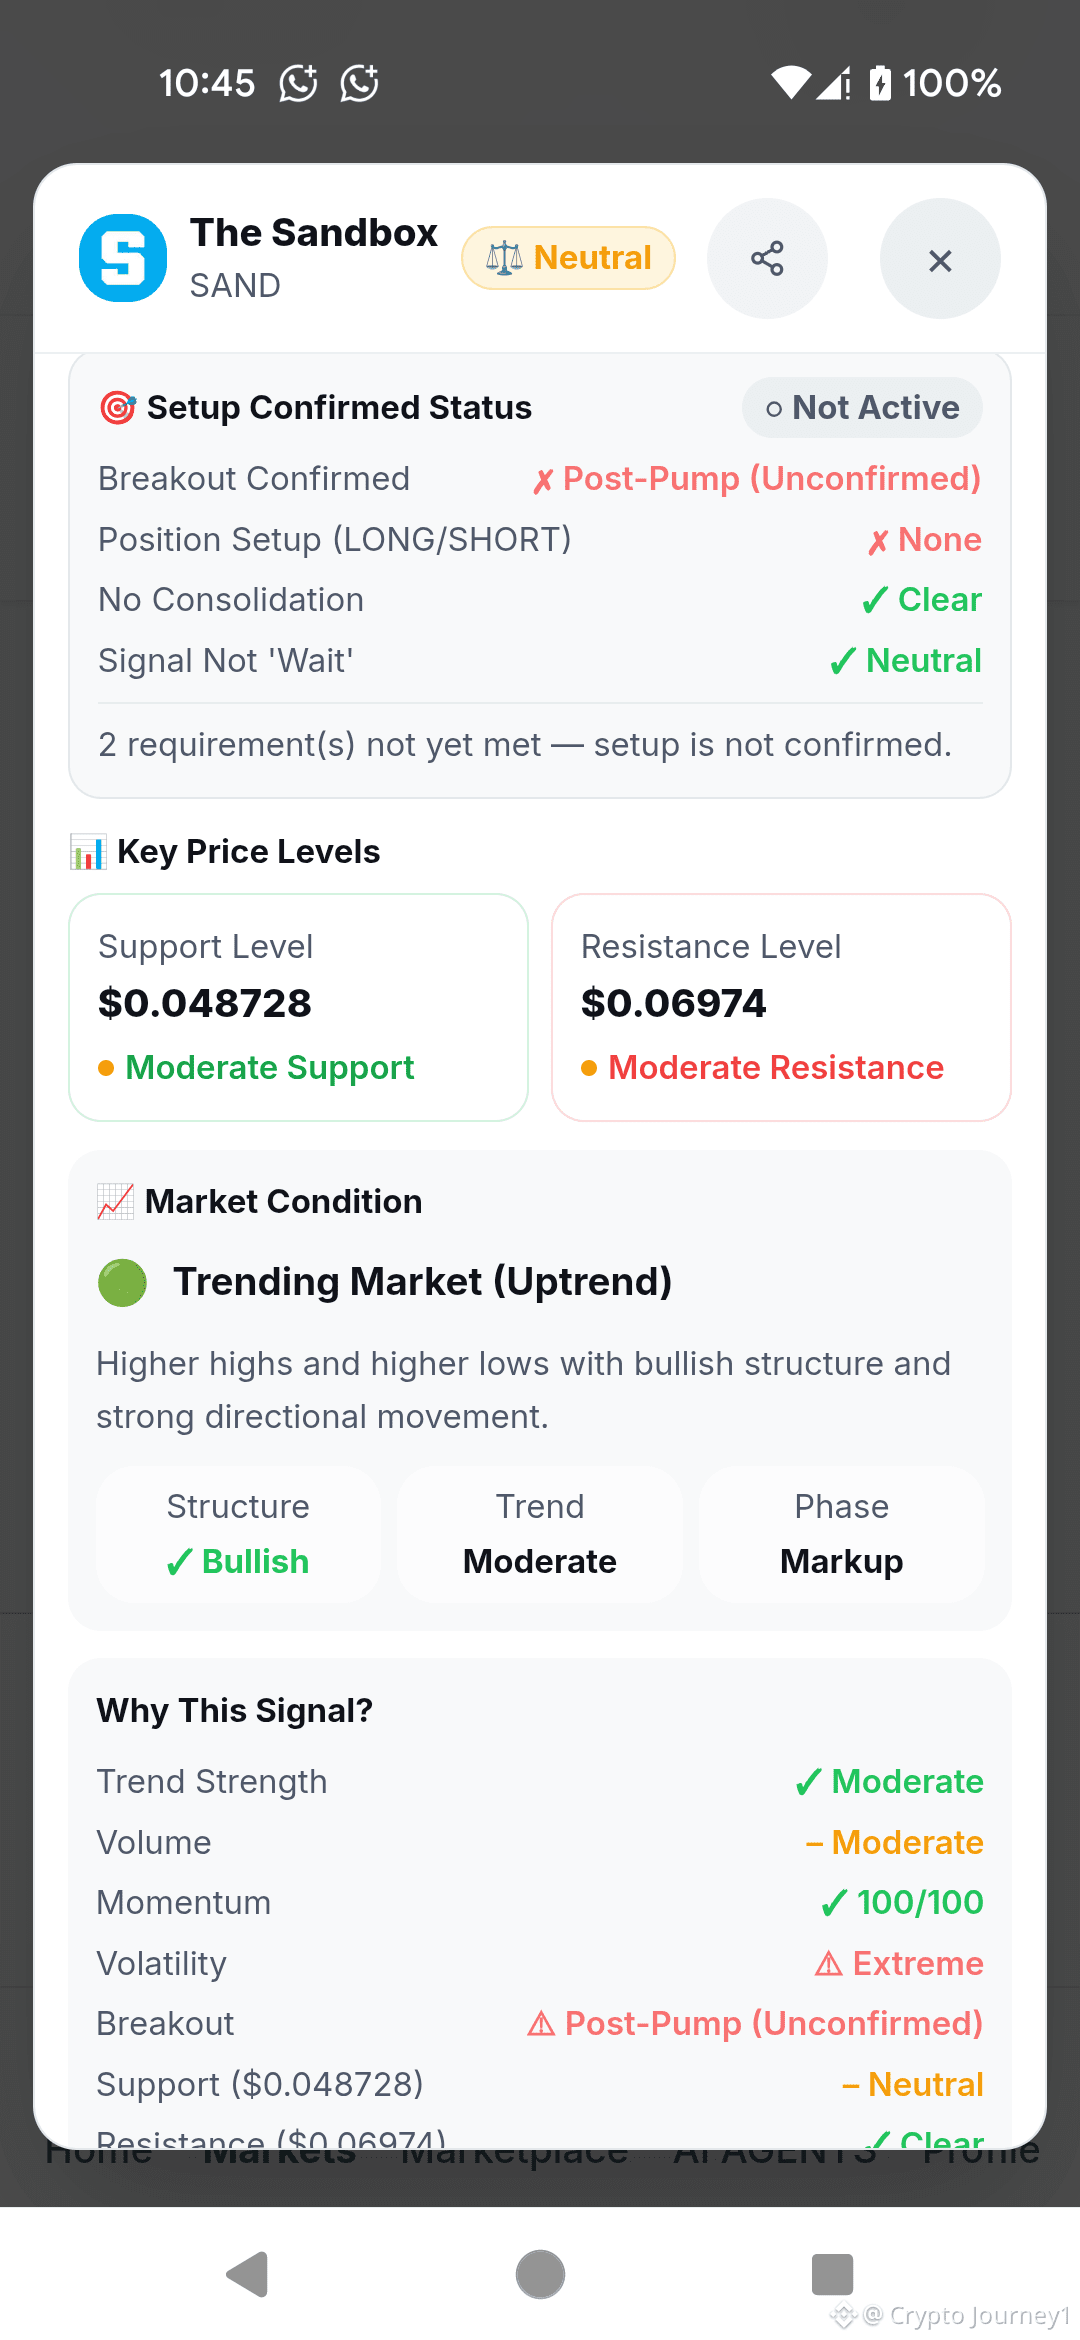
First, look at the top. It says Neutral. But don't just stop there. Let's read the details underneath, because they tell the real story.
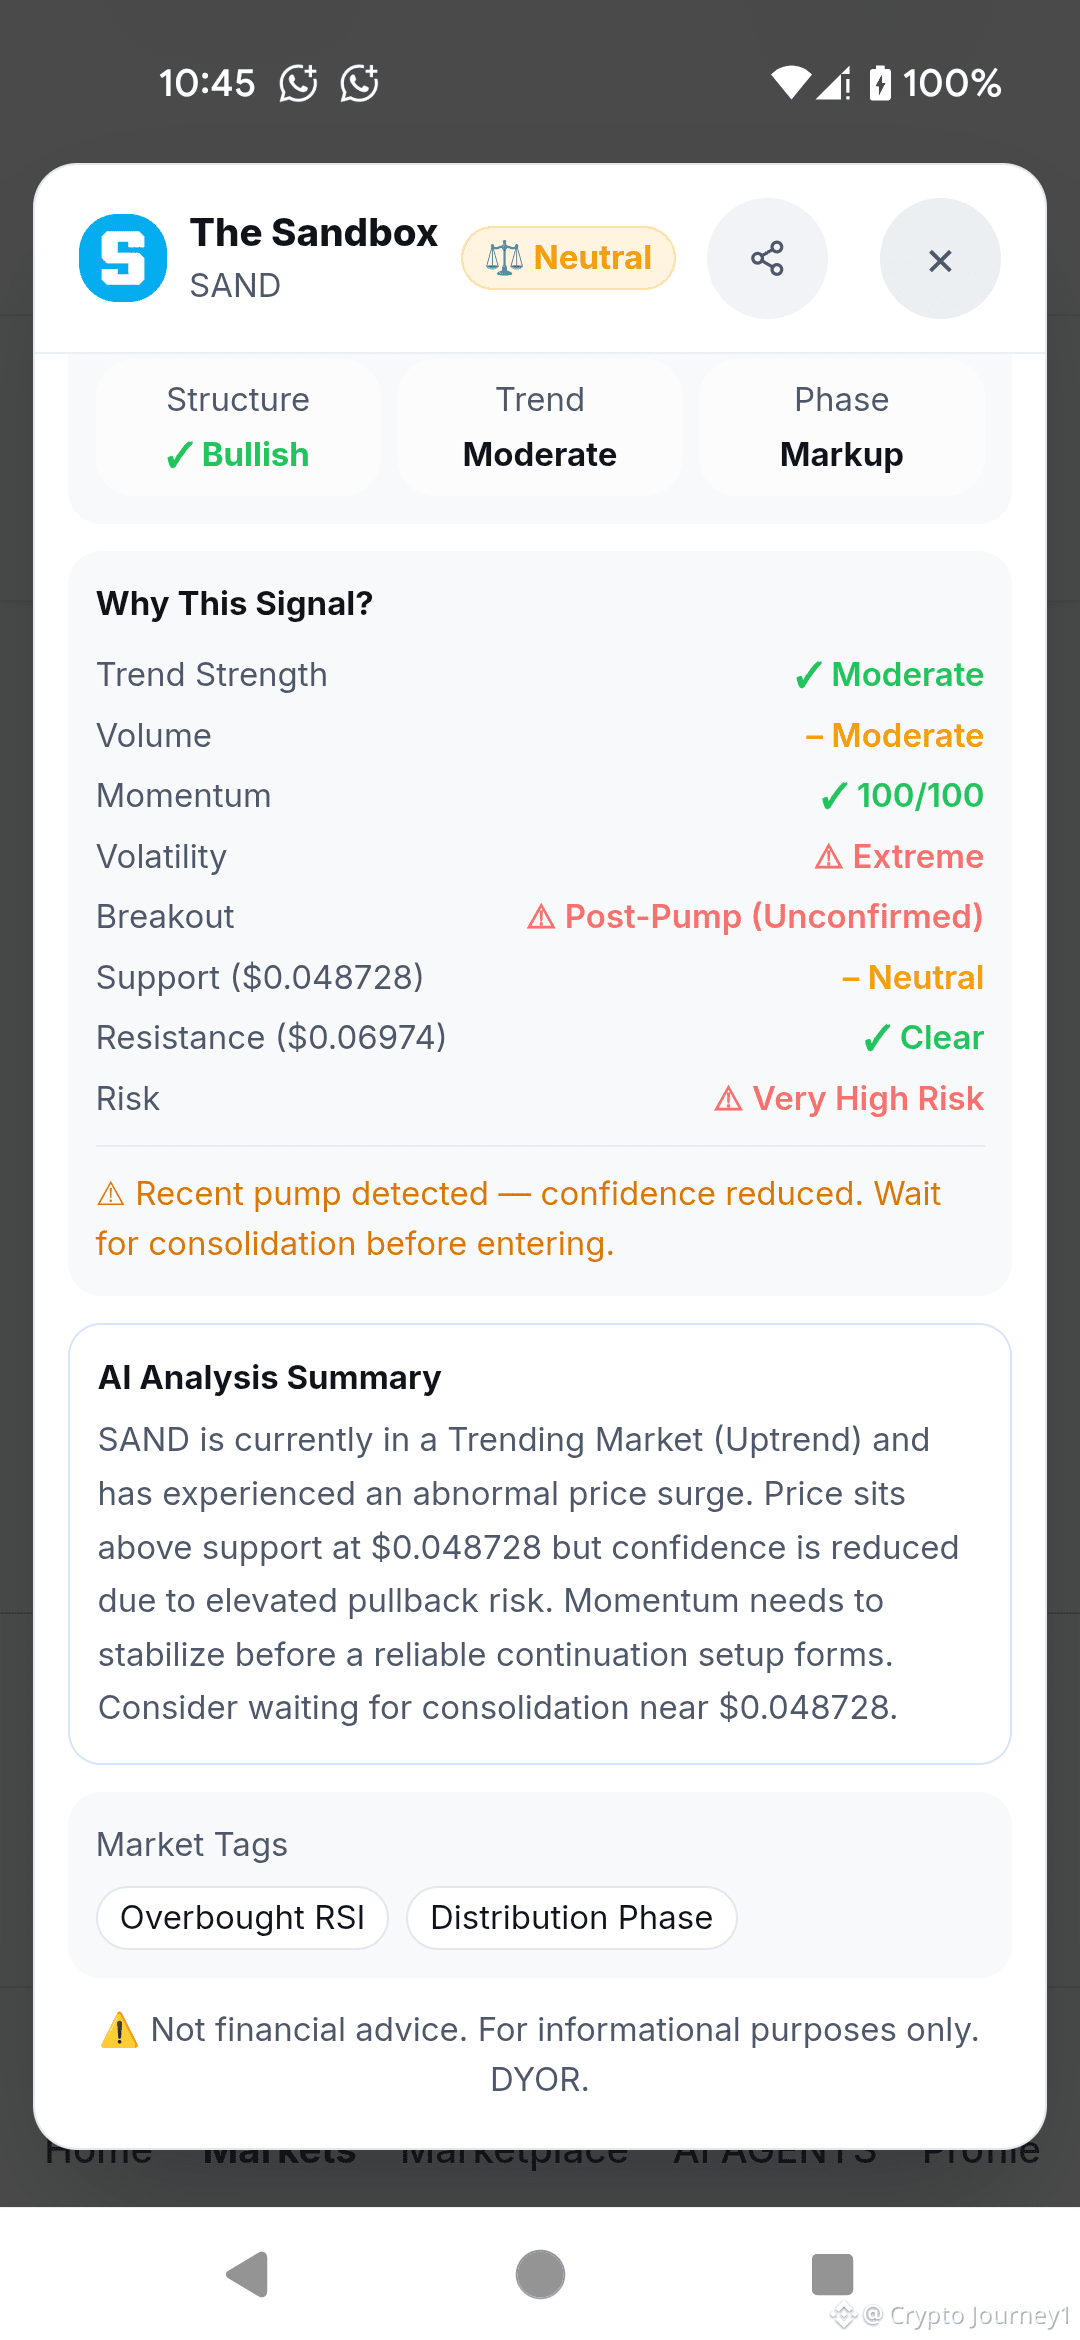
Look at the good stuff first. Structure is Bullish. Trend is Moderate. We are in a Markup phase. Momentum is completely maxed out at 100/100.
Now look at the red flags. Volatility is Extreme. Risk is Very High Risk. Breakout is Post-Pump (Unconfirmed).
What does the app tell us? It says: "Recent pump detected — confidence reduced. Wait for consolidation before entering." It also tags this as Overbought RSI and Distribution Phase. If you look at the setup screen, it says Not Active. Two requirements are not met.
So, what are the levels?
Support sits at $0.048728.
Resistance sits at $0.06974.
Class, what is the lesson here? Do not chase a pump into a distribution phase. The smart move is to wait. If you want to enter a long, wait for the price to drop back to the support zone at $0.048728 and stabilize. Let it consolidate there first. If it breaks below that support, it will flush.
Don't rush. Let the market finish its move.
chart together.
First, look at the top. It says Neutral. But don't just stop there. Let's read the details underneath, because they tell the real story.
Look at the good stuff first. Structure is Bullish. Trend is Moderate. We are in a Markup phase. Momentum is completely maxed out at 100/100.
Now look at the red flags. Volatility is Extreme. Risk is Very High Risk. Breakout is Post-Pump (Unconfirmed).
What does the app tell us? It says: "Recent pump detected — confidence reduced. Wait for consolidation before entering." It also tags this as Overbought RSI and Distribution Phase. If you look at the setup screen, it says Not Active. Two requirements are not met.
So, what are the levels?
Support sits at $0.048728.
Resistance sits at $0.06974.
Class, what is the lesson here? Do not chase a pump into a distribution phase. The smart move is to wait. If you want to enter a long, wait for the price to drop back to the support zone at $0.048728 and stabilize. Let it consolidate there first. If it breaks below that support, it will flush.
Don't rush. Let the market finish its move.