$INTC/$ENJ/$AMD 30-minute golden cross, 4-hour bullish confirmation🔥
════════════════════
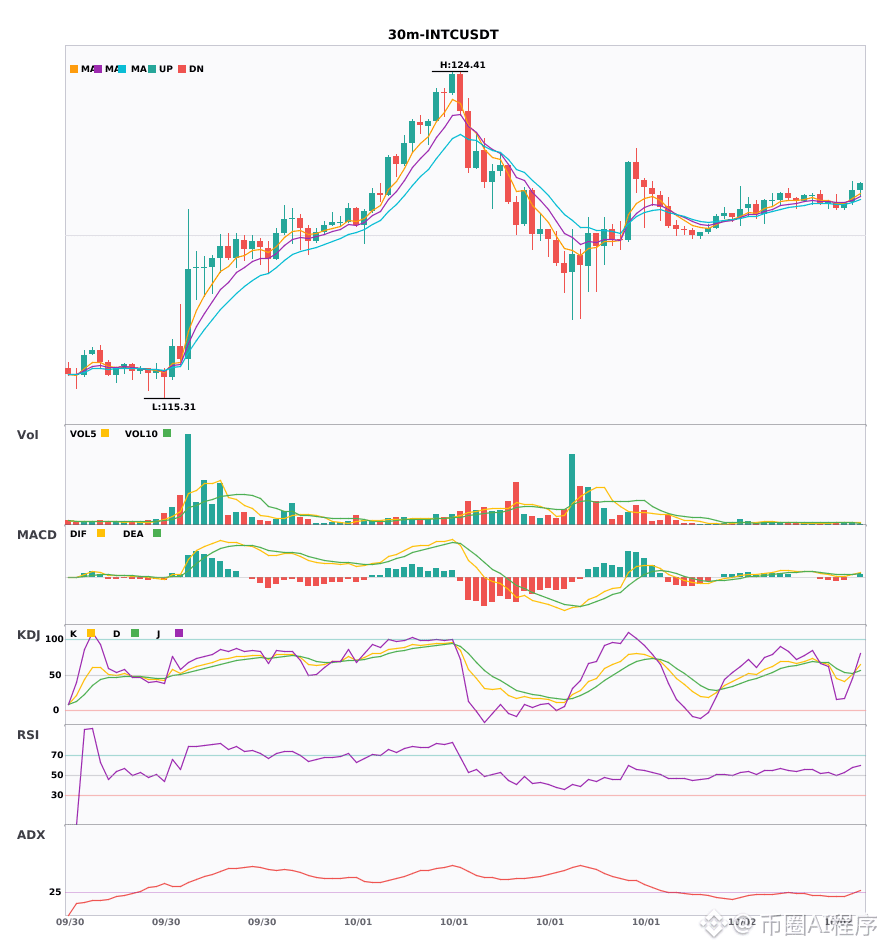
🔴 $INTC 30-minute bullish signal
⚠️ Technical analysis: A 30-minute entry signal, with 4-hour bullish resonance confirmation. MACD golden cross above zero with increased volume; EMA5 crossing above EMA8 just turned bullish; KDJ remains strong with bulls in control.
════════════════════
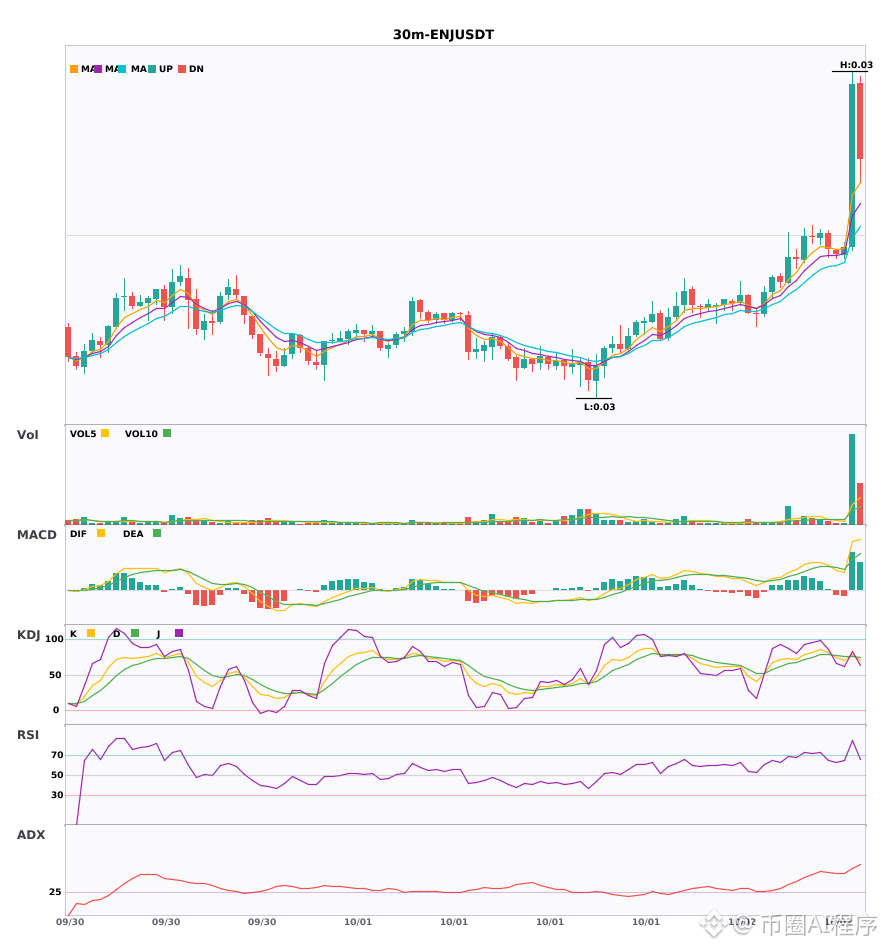
🔴 $ENJ 30-minute bullish signal
⚠️ Technical analysis: After the 30-minute MACD golden cross, volume surged and the red histogram keeps expanding; moving averages are in a bullish alignment, diverging upward; KDJ has formed a golden cross but is already in the overbought zone (K78.5 D76.3); trading volume exploded by 6.4x. 4-hour bullish resonance confirmation, with multi-timeframe alignment in the same direction—bullish outlook in the short term.
════════════════════
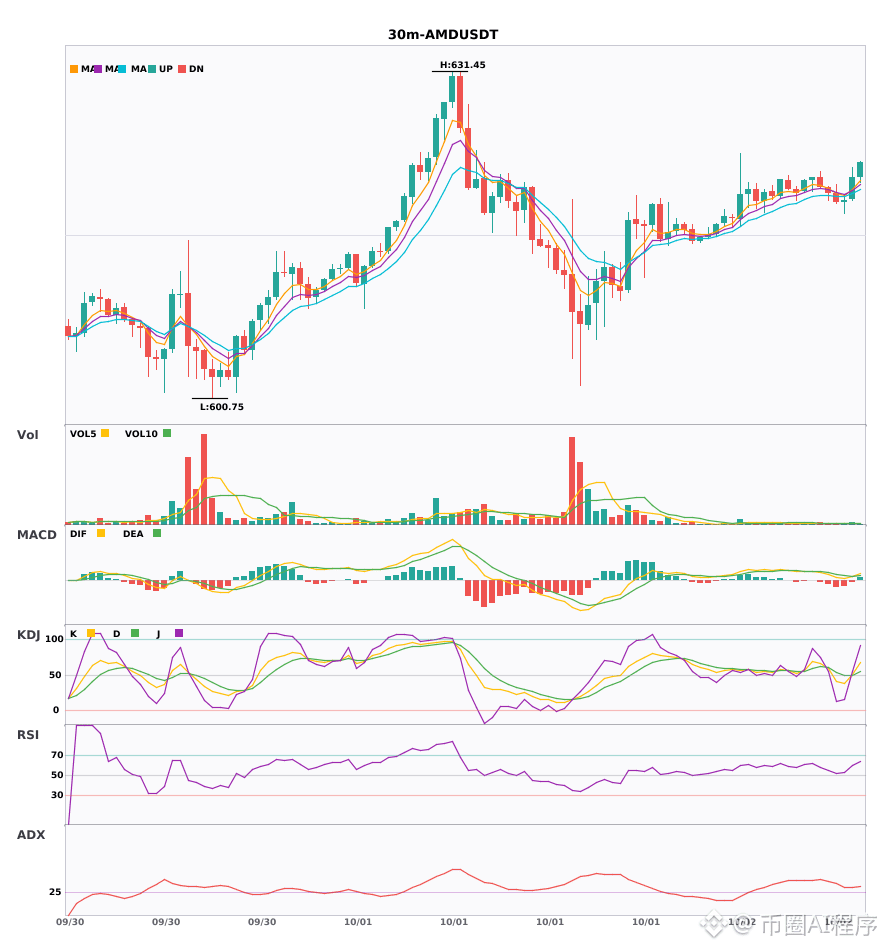
🔴 $AMD 30-minute bullish signal
⚠️ Technical analysis: On the 30-minute chart, EMA5 crosses above EMA8 to turn bullish; KDJ forms a golden cross (K51 D49), not yet overbought; volume increases by 1.6x; 4-hour same-direction resonance confirmation
════════════════════
🔔 Get first-hand info on market anomalies 🔔
#多周期共振 #INTC #ENJ #AMD
📌 When trading, be sure to check whether the candlestick patterns match
════════════════════
🔴 $INTC 30-minute bullish signal
⚠️ Technical analysis: A 30-minute entry signal, with 4-hour bullish resonance confirmation. MACD golden cross above zero with increased volume; EMA5 crossing above EMA8 just turned bullish; KDJ remains strong with bulls in control.
════════════════════
🔴 $ENJ 30-minute bullish signal
⚠️ Technical analysis: After the 30-minute MACD golden cross, volume surged and the red histogram keeps expanding; moving averages are in a bullish alignment, diverging upward; KDJ has formed a golden cross but is already in the overbought zone (K78.5 D76.3); trading volume exploded by 6.4x. 4-hour bullish resonance confirmation, with multi-timeframe alignment in the same direction—bullish outlook in the short term.
════════════════════
🔴 $AMD 30-minute bullish signal
⚠️ Technical analysis: On the 30-minute chart, EMA5 crosses above EMA8 to turn bullish; KDJ forms a golden cross (K51 D49), not yet overbought; volume increases by 1.6x; 4-hour same-direction resonance confirmation
════════════════════
🔔 Get first-hand info on market anomalies 🔔
#多周期共振 #INTC #ENJ #AMD
📌 When trading, be sure to check whether the candlestick patterns match