CRYPTO MARKET UPDATE & TECHNICAL ANALYSIS: ENA/USDT REBOUNDING FROM SUPPORT
Market Overview: Ethena (ENA) Eyeballs Recovery After Correction
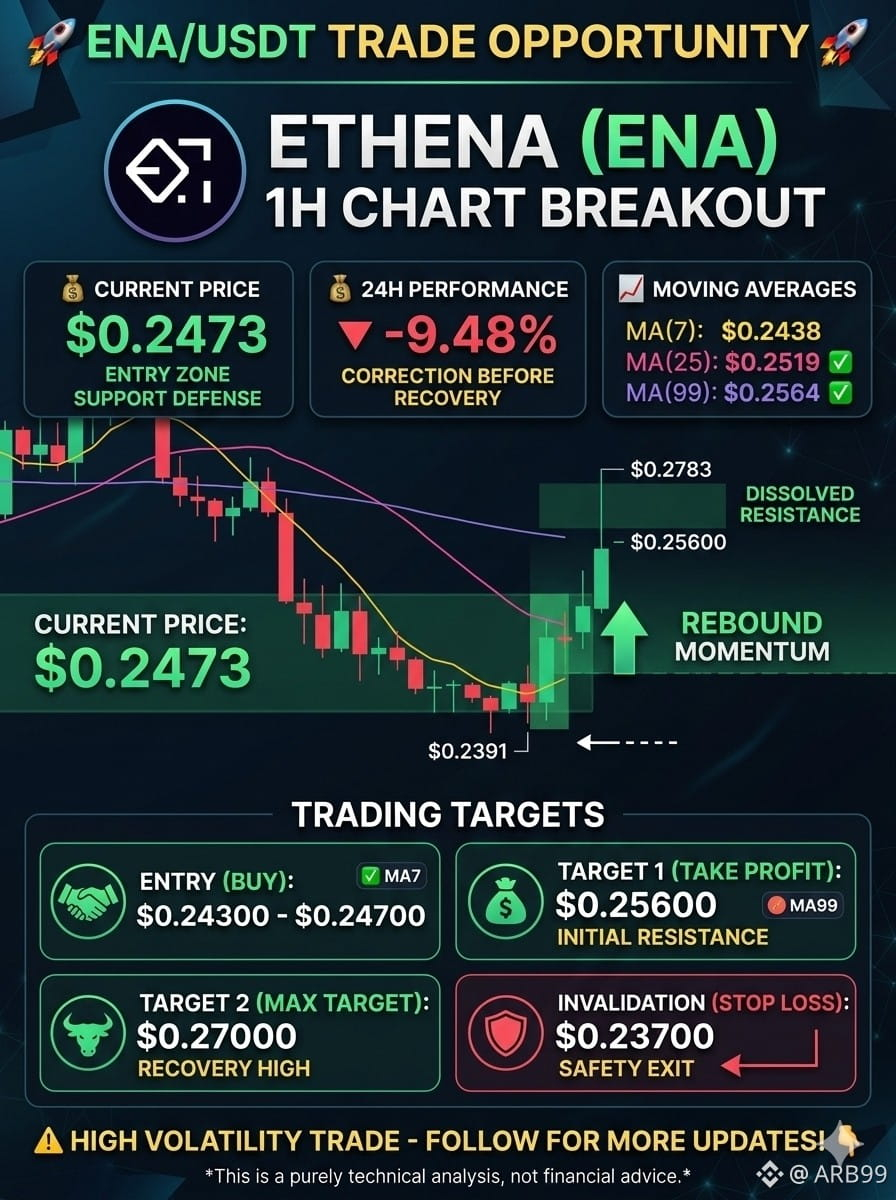
Ethena (ENA) has faced a sharp correction over the last 24 hours, dropping -9.48% to find a local bottom at $0.2391. However, the 1-hour chart currently reveals a strong bullish reversal candle at the bottom, indicating that buyers are stepping in to defend this support zone.
Technical Analysis: 1-Hour Chart Breakdown
* Local Bottom & Reversal: After hitting a 24h low of $0.2391, ENA has bounced back to $0.2473. It has successfully broken above the immediate dynamic resistance of the MA(7) line ($0.2438).
* Upcoming Resistances: The next immediate targets for the bulls are the MA(25) at $0.2519 and the critical horizontal resistance near $0.2564 (MA 99).
* Volume Check: The 24h Vol(ENA) sits at a healthy 261.24M, confirming decent liquidity and interest around this dip-buying region.
------------------------------------------------------------------
POTENTIAL TRADING SETUP (SPOT / SWING TRADE)
Since ENA is showing early signs of a trend reversal from the bottom, a tight invalidation setup offers an excellent risk-to-reward ratio.
* Current Price: $0.2473
* Strategic Entry Zone: $0.24300 – $0.24700
(Buying the current momentum or waiting for a minor retest of the MA7 line)
* Take-Profit Target 1: $0.25600 (Testing the MA99 resistance area)
* Take-Profit Target 2: $0.27000 (Major swing high recovery)
* Strict Stop-Loss: $0.23700
(Set safely just below the recent swing low of $0.2391 to contain any downside risk)
------------------------------------------------------------------
Risk Disclaimer: Altcoins experiencing heavy daily drops carry significant volatility. This analysis is purely educational and does not constitute financial advice. Always execute proper risk management and size your positions accordingly.
Market Overview: Ethena (ENA) Eyeballs Recovery After Correction
Ethena (ENA) has faced a sharp correction over the last 24 hours, dropping -9.48% to find a local bottom at $0.2391. However, the 1-hour chart currently reveals a strong bullish reversal candle at the bottom, indicating that buyers are stepping in to defend this support zone.
Technical Analysis: 1-Hour Chart Breakdown
* Local Bottom & Reversal: After hitting a 24h low of $0.2391, ENA has bounced back to $0.2473. It has successfully broken above the immediate dynamic resistance of the MA(7) line ($0.2438).
* Upcoming Resistances: The next immediate targets for the bulls are the MA(25) at $0.2519 and the critical horizontal resistance near $0.2564 (MA 99).
* Volume Check: The 24h Vol(ENA) sits at a healthy 261.24M, confirming decent liquidity and interest around this dip-buying region.
------------------------------------------------------------------
POTENTIAL TRADING SETUP (SPOT / SWING TRADE)
Since ENA is showing early signs of a trend reversal from the bottom, a tight invalidation setup offers an excellent risk-to-reward ratio.
* Current Price: $0.2473
* Strategic Entry Zone: $0.24300 – $0.24700
(Buying the current momentum or waiting for a minor retest of the MA7 line)
* Take-Profit Target 1: $0.25600 (Testing the MA99 resistance area)
* Take-Profit Target 2: $0.27000 (Major swing high recovery)
* Strict Stop-Loss: $0.23700
(Set safely just below the recent swing low of $0.2391 to contain any downside risk)
------------------------------------------------------------------
Risk Disclaimer: Altcoins experiencing heavy daily drops carry significant volatility. This analysis is purely educational and does not constitute financial advice. Always execute proper risk management and size your positions accordingly.