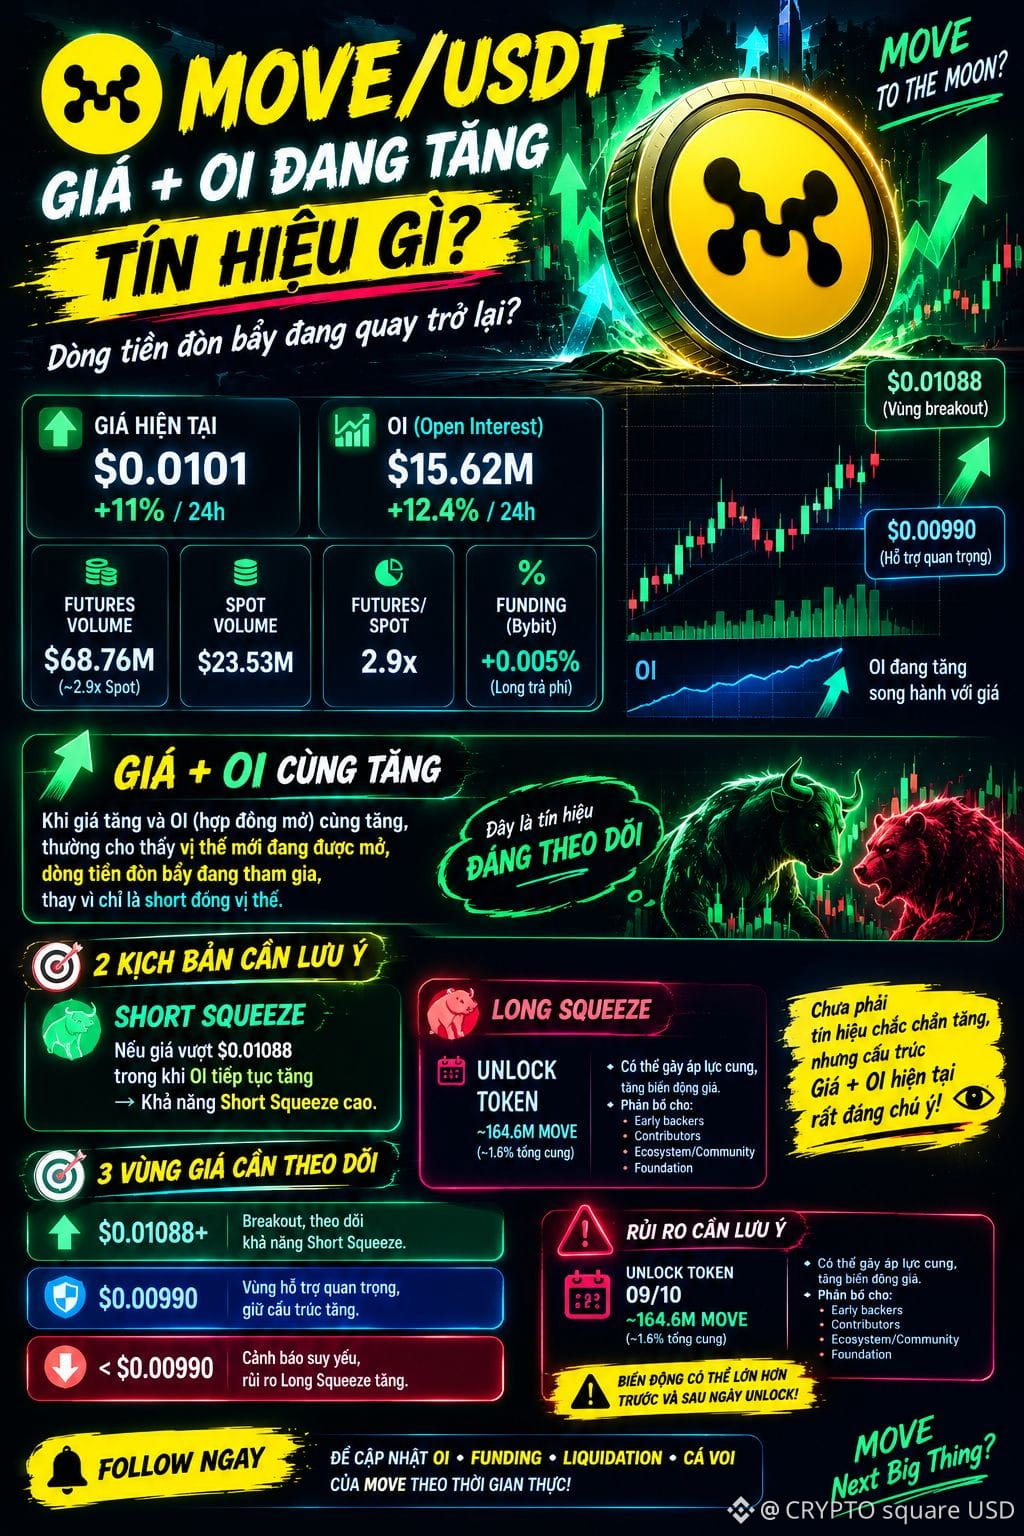
MOVE “HOT” UP? DATA STARTS TO BE STRANGE! PRICE RISES, OI RISES — WHAT SIGNAL IS THIS?
📈 MOVE price +11%/24h
📊 OI ~15.6M USD and is increasing
💰 Futures Volume ~68.8M USD
The key point is: PRICE ↑ + OI ↑ happening at the same time.
👉 This often indicates new positions are being opened and leveraged capital is joining in, instead of just short positions closing.
🔥 If the price breaks above $0.01088 while OI continues to rise → watch for the possibility of a Short Squeeze.
⚠️ Conversely, if the price falls but OI remains high/continues to rise → the amount of trapped Longs could be large, and the risk of a Long Squeeze increases.
🎯 MOVE is not yet a “sure bullish” signal — but the Price + OI structure is definitely worth monitoring closely$MOVE
📈 MOVE price +11%/24h
📊 OI ~15.6M USD and is increasing
💰 Futures Volume ~68.8M USD
The key point is: PRICE ↑ + OI ↑ happening at the same time.
👉 This often indicates new positions are being opened and leveraged capital is joining in, instead of just short positions closing.
🔥 If the price breaks above $0.01088 while OI continues to rise → watch for the possibility of a Short Squeeze.
⚠️ Conversely, if the price falls but OI remains high/continues to rise → the amount of trapped Longs could be large, and the risk of a Long Squeeze increases.
🎯 MOVE is not yet a “sure bullish” signal — but the Price + OI structure is definitely worth monitoring closely$MOVE