$NEAR Spot prices get hammered in a single day, dropping nearly 10%, while the contract open interest keeps rising—this doesn’t look like clearing; it looks like liquidation driven by leverage.
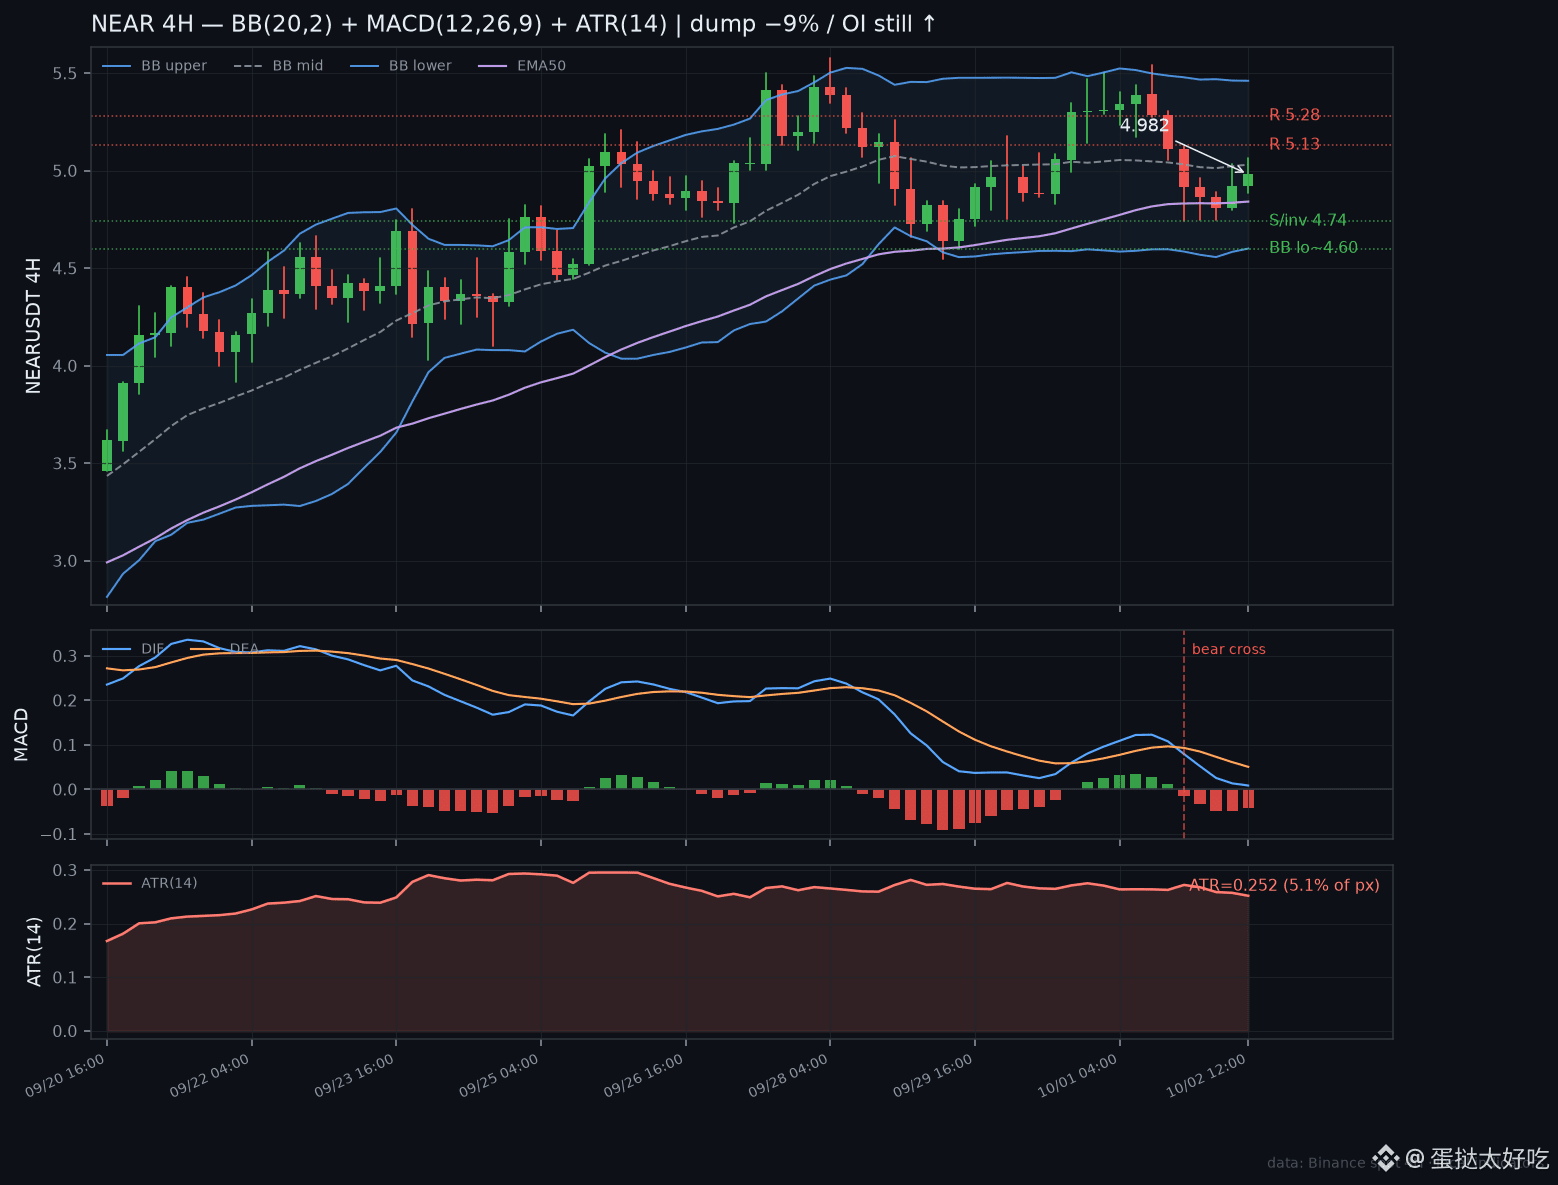
Current price is about 4.98 (24h −9.0%). The high is 5.54 and the low is 4.74. Turnover is around $244 million. 4H: BB(20,2) midline 5.03 / upper band 5.46 / lower band 4.60; bandwidth about 17%, %B≈0.44. Price is just rebounding from the lower half toward the midline. MACD(12,26,9): DIF 0.0089 / DEA 0.0509 / histogram −0.042. After the dead cross at 20:00 on 10/1, the histogram is still negative, and the last couple of bars have narrowed slightly. ATR(14)=0.252, about 5.1% of the current price—volatility hasn’t compressed yet.
The contract side is even more striking: OI up 0.8% over 24h and +5.1% over 7 days; price is falling while positions are increasing. The 21-period average funding rate is about 0.0074% (rough annualized estimate ~8%), with 0 times at the maximum level. Big players’ L/S positions fell from about 2.81 roughly 48h ago to 2.15; retail is about 1.58—there’s still a gap.
Structurally: the swing high is stepping down from 5.58→5.54 (lower high). The prior low at 4.74 is the anchor for this selloff. For the upside, first watch the midline / prior bounce at 5.03–5.13, then 5.28. For support, look at EMA50≈4.84 and 4.74; if 4.74 is lost, a break-and-close below it on the 4H chart would be bearish.
Price is leaking, positions are adding, and volatility hasn’t shrunk—should we first wash out the leverage before talking about the midline, or is 4.74 already enough and we should directly go test 5.13? What do you think?
$NEAR #NEAR #技术分析 #Contract data
Current price is about 4.98 (24h −9.0%). The high is 5.54 and the low is 4.74. Turnover is around $244 million. 4H: BB(20,2) midline 5.03 / upper band 5.46 / lower band 4.60; bandwidth about 17%, %B≈0.44. Price is just rebounding from the lower half toward the midline. MACD(12,26,9): DIF 0.0089 / DEA 0.0509 / histogram −0.042. After the dead cross at 20:00 on 10/1, the histogram is still negative, and the last couple of bars have narrowed slightly. ATR(14)=0.252, about 5.1% of the current price—volatility hasn’t compressed yet.
The contract side is even more striking: OI up 0.8% over 24h and +5.1% over 7 days; price is falling while positions are increasing. The 21-period average funding rate is about 0.0074% (rough annualized estimate ~8%), with 0 times at the maximum level. Big players’ L/S positions fell from about 2.81 roughly 48h ago to 2.15; retail is about 1.58—there’s still a gap.
Structurally: the swing high is stepping down from 5.58→5.54 (lower high). The prior low at 4.74 is the anchor for this selloff. For the upside, first watch the midline / prior bounce at 5.03–5.13, then 5.28. For support, look at EMA50≈4.84 and 4.74; if 4.74 is lost, a break-and-close below it on the 4H chart would be bearish.
Price is leaking, positions are adding, and volatility hasn’t shrunk—should we first wash out the leverage before talking about the midline, or is 4.74 already enough and we should directly go test 5.13? What do you think?
$NEAR #NEAR #技术分析 #Contract data