🔥 $BTC EN VOLATILITY EXPANSION: Advanced analysis of liquidity sweep and an anomaly in the RSI
When we observe bullish breakouts during the early Asian session on Friday, we are generally looking at a liquidity sweep (buy-side liquidity sweep). Institutional money seeks to liquidate leveraged short traders before the traditional weekly close, forcing a rapid expansion of volatility.
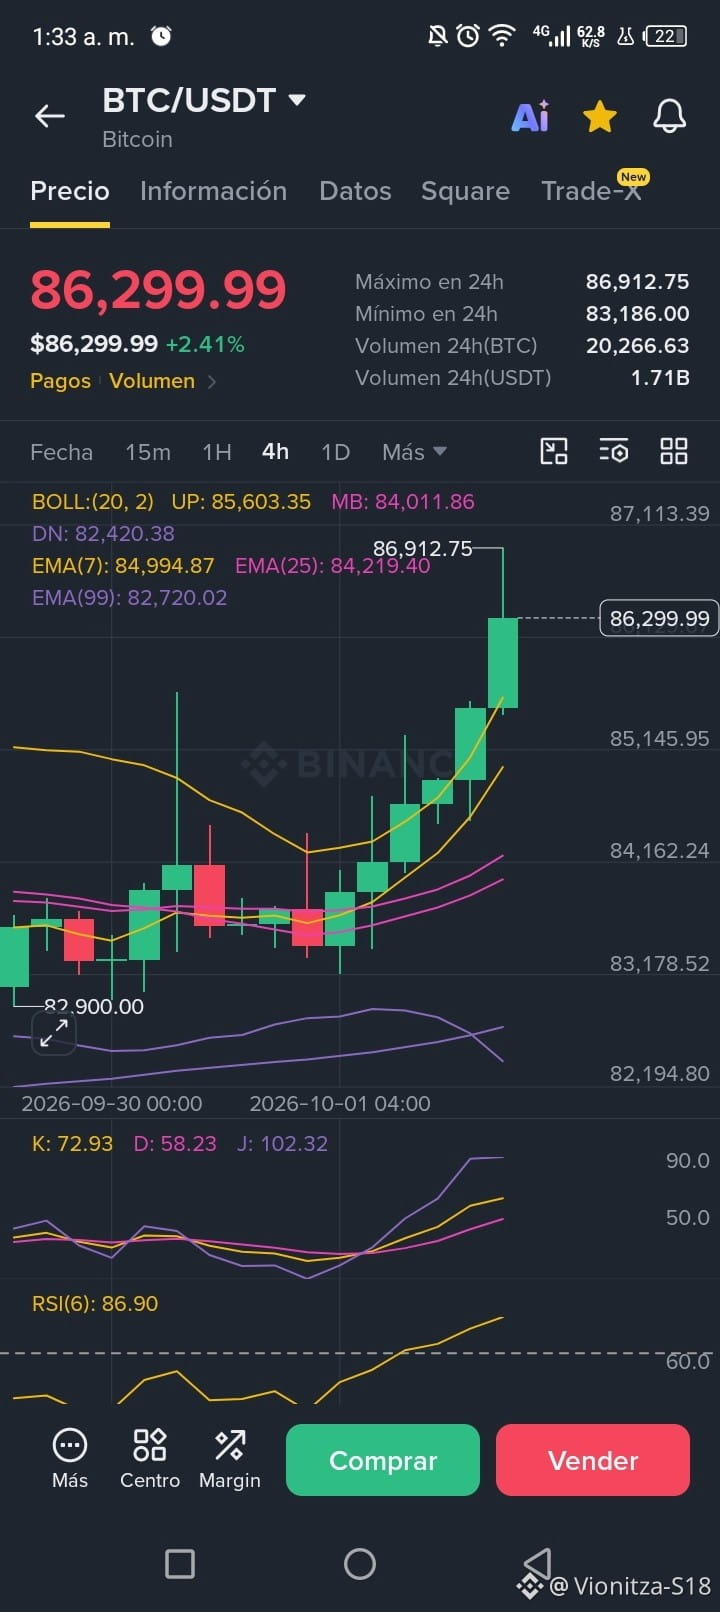
If we break down the 4-hour chart, Bitcoin ($BTC ) didn’t just break resistances—by trading at $86,299.99 it aggressively pierced the upper Bollinger Band ($85,603.35). Statistically, the price is operating outside its 2 standard deviations, creating an inefficiency or imbalance versus its mean.
Additionally, the spread (distance) between the 7 EMA ($84,994) and the 25 EMA ($84,219) is sharply widening, leaving a liquidity gap below. On top of that, the RSI at 86.90: this is not a simple overbought condition—it's an extreme momentum anomaly.
CONCLUSION: Buying in this zone offers a very poor Risk/Reward (R/R) for late Longs. The highest-probability technical scenario calls for a move back to the mean (retest), either by targeting the upper Bollinger Band as a new support, or dropping toward the 7 EMA to refill liquidity before attempting to break through $87,000.
⚡ Trade the levels, not your emotions! Check market depth.
👇 Tap the buttons on the interactive card for $BTC below. Open the live chart, review the order book, and adjust your risk management in 1 click.
👉 Trader, let’s get into the technical debate! Do you think this momentum sustains the expansion, or will we see a correction toward the 7 EMA before the close of Wall Street? Follow me and share your view below!
When we observe bullish breakouts during the early Asian session on Friday, we are generally looking at a liquidity sweep (buy-side liquidity sweep). Institutional money seeks to liquidate leveraged short traders before the traditional weekly close, forcing a rapid expansion of volatility.
If we break down the 4-hour chart, Bitcoin ($BTC ) didn’t just break resistances—by trading at $86,299.99 it aggressively pierced the upper Bollinger Band ($85,603.35). Statistically, the price is operating outside its 2 standard deviations, creating an inefficiency or imbalance versus its mean.
Additionally, the spread (distance) between the 7 EMA ($84,994) and the 25 EMA ($84,219) is sharply widening, leaving a liquidity gap below. On top of that, the RSI at 86.90: this is not a simple overbought condition—it's an extreme momentum anomaly.
CONCLUSION: Buying in this zone offers a very poor Risk/Reward (R/R) for late Longs. The highest-probability technical scenario calls for a move back to the mean (retest), either by targeting the upper Bollinger Band as a new support, or dropping toward the 7 EMA to refill liquidity before attempting to break through $87,000.
⚡ Trade the levels, not your emotions! Check market depth.
👇 Tap the buttons on the interactive card for $BTC below. Open the live chart, review the order book, and adjust your risk management in 1 click.
👉 Trader, let’s get into the technical debate! Do you think this momentum sustains the expansion, or will we see a correction toward the 7 EMA before the close of Wall Street? Follow me and share your view below!