
Ocean of trading | Psychology, math, and capital management #ZEC
We are used to analyzing cryptocurrency charts: looking for patterns, identifying trends, finding support and resistance levels, and assessing the probability of a correction. But for some reason we rarely apply the same logic to ourselves — to our own deposit.
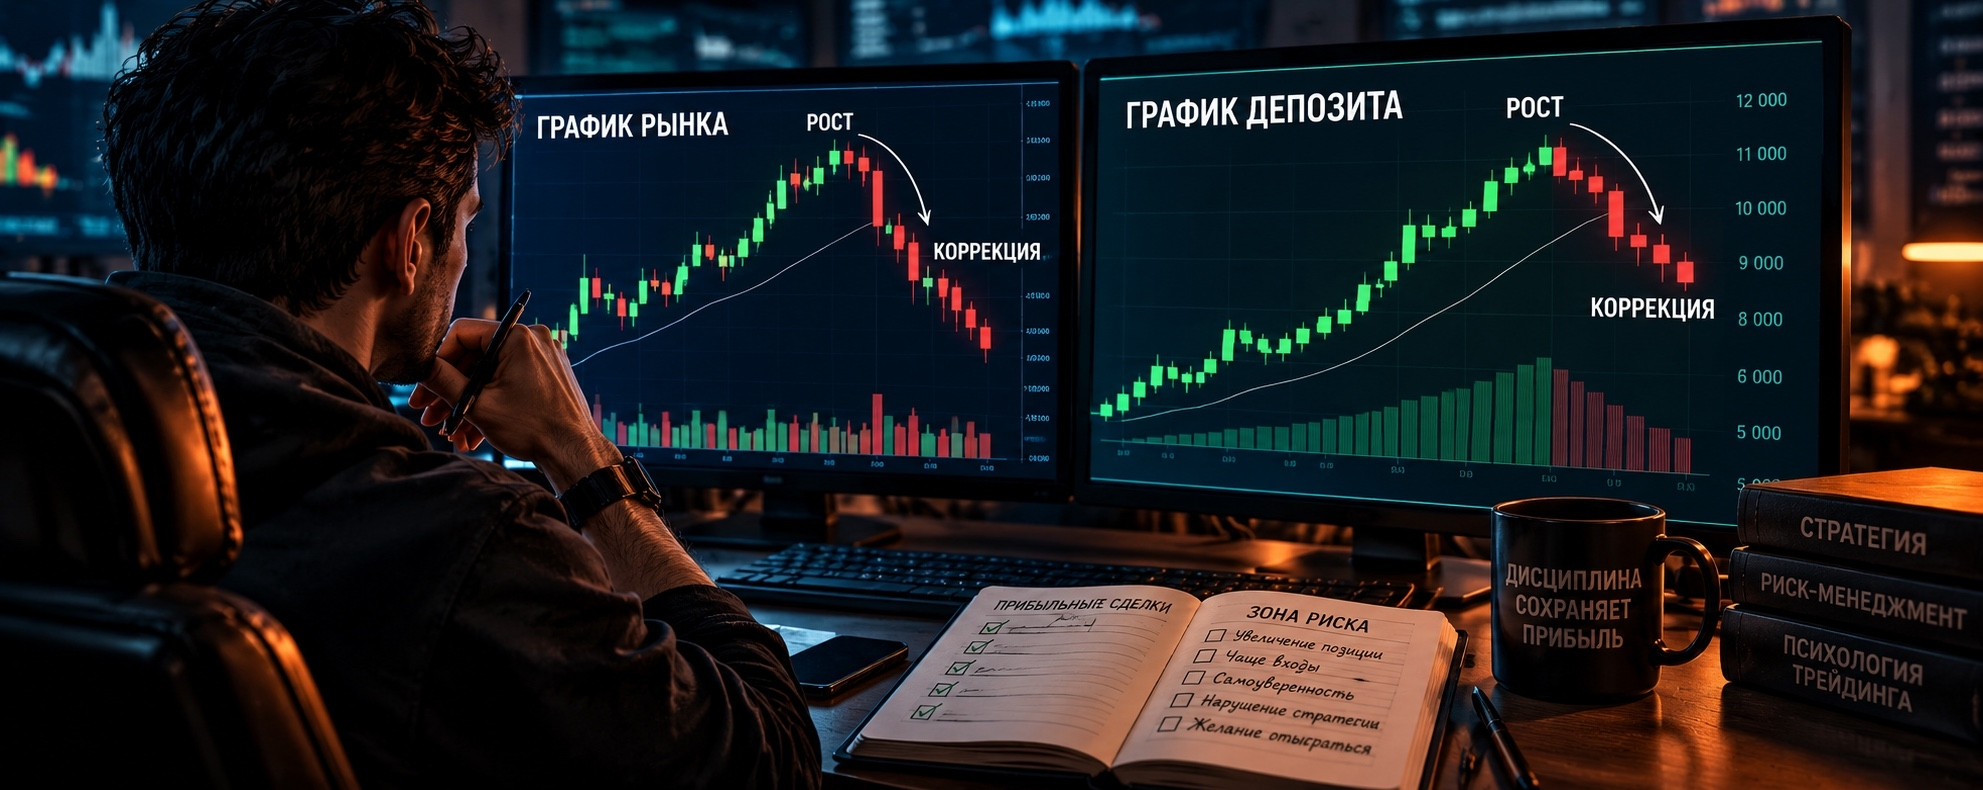
A trader’s balance chart follows the same math as any other chart.
Imagine this: you’ve made several successful trades, your account is growing, and your confidence is rising. It feels like you’ve finally caught a wave and can now trade with a larger position. But this is exactly when you should stop and look at your own chart.
What if, after a series of profitable trades, your account is approaching a local high, and the next correction is no longer a question of the market, but of your own statistics and behavior?
📊 Your account balance is a chart too
Every chart consists of upward and downward moves and periods of consolidation. A trader’s account is no different.
An uptrend means a series of profitable trades, sound risk management, and growing capital.
A local high is a period when a trader reaches a new peak in their account balance.
A correction means several losing trades, giving back some of your profits, or a decline in trading performance.
Recovery means returning to the previous high and trying to continue the uptrend.
🦈 Why does a rise bring danger?
This is where things get interesting. In the market, we look for overbought conditions, overheated moves, and signs that buyers are running out of steam. Similar factors exist in your own trading, even if they aren’t precise technical indicators.
After several profitable trades, a trader may:
Increase their position size, thinking they understand the market.
Lower their standards for entry points.
Enter trades more often, afraid of missing a move.
Stop following your initial risk management rules.
Mistake a winning streak for your own skill.
As a result, not only does your balance grow, but so does the likelihood of making a mistake out of overconfidence.
However, it’s important to understand that a series of profitable trades doesn’t in itself mean a correction is inevitable. If a trader has a statistical edge, their winning streak may continue. But the more their behavior and risk change, the more likely they are to give back their gains to the market.
📉 The math behind an account drawdown
Let’s imagine an account starting at $1,000. After a series of successful trades, it grows to $1,500. Then the trader loses 20% of the new balance.
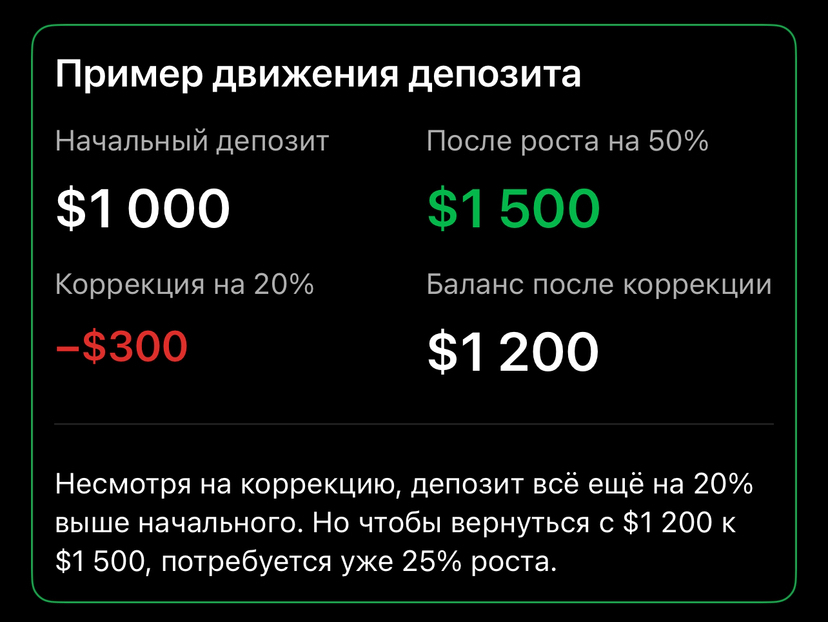
This is one of the most important features of capital math: the percentage loss and the percentage gain needed to recover are not symmetrical.
The deeper the drawdown, the higher the return needed to get back to the previous high.
🧠 The most dangerous trap isn’t the correction—it’s the urge to win back your losses
When the market corrects, we don’t always take it in stride—especially after a long winning streak.
The trader watches their account shrink and tries to recover their losses as quickly as possible. They increase leverage, open additional positions, and break their own trading system.
This is how an ordinary correction turns into a deep drawdown.
In the ocean of trading, a shark doesn’t have to eat all its prey in one go. It knows how to wait for the right moment. Small fish, meanwhile, often let their guard down when they manage to find food several times in a row.
🎯 How can you use this pattern in practice?
Instead of trying to guess the exact date of a correction, you can control your own actions:
Keep a chart of your account balance. Track not only profits and losses, but also risk per trade, the number of trades, and whether you’re following your strategy.
Track deviations from your system. If you start entering the market more often or increasing your positions after a winning streak, it’s time to reassess your behavior.
Set a drawdown limit. Decide in advance at what drop in your balance you’ll stop trading and review your mistakes.
Don’t confuse a growing balance with growing skill. Short-term profit may be the result of luck, not a sustainable edge.
Protect your gains. If necessary, reduce your risk, take some profits, and don’t let emotions dictate your position size.
🦈 Takeaway: analyze not only the market, but yourself as well #AVAX
We spend hours looking for patterns in cryptocurrency charts, studying volume, open interest, liquidations, and the behavior of major players. Yet we often ignore the most important chart of all—the chart of our own capital.
The market doesn’t have to correct after every winning streak. But a trader who doesn’t analyze their own results risks turning temporary luck into a long-term loss.
Perhaps a trader’s most important skill isn’t the ability to predict the next market correction, but the ability to spot when their account is overheating and keep greed from wiping out their gains.
Do you analyze your account balance chart as carefully as the chart of the coin you trade?
And remember, we’re not sharks; we’re just remoras who can eat alongside them #BTC