$BNB When it broke through the Keltner upper band, the funding rate was still 0—the thing that’s overheated is the indicator, not the leverage.
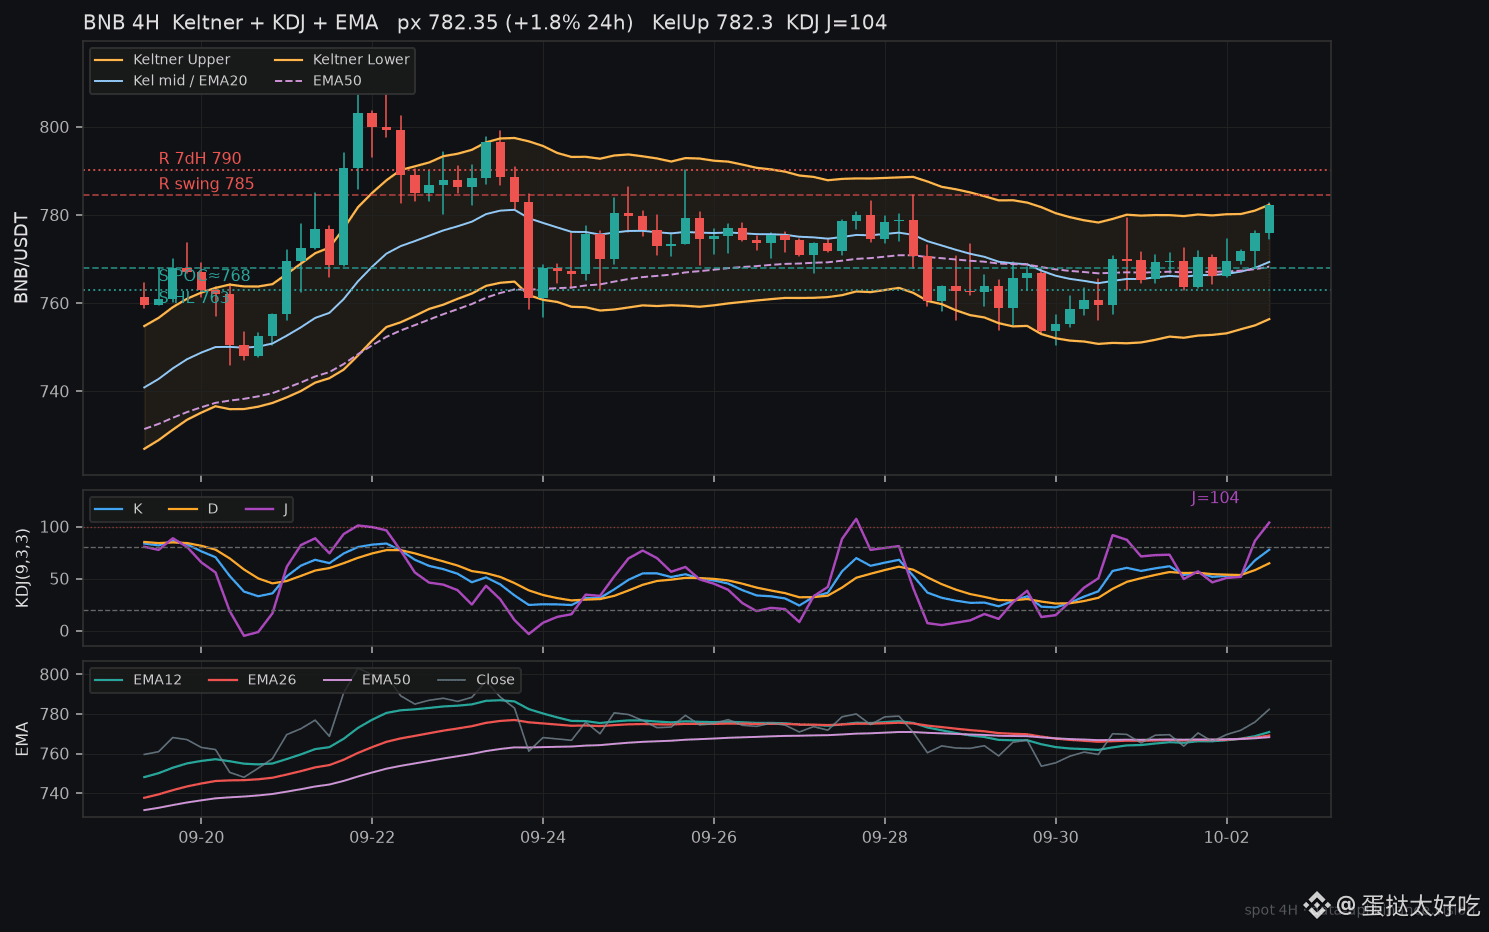
Current price is about 782.4 (24h +1.8%). 4H: Keltner (EMA20, ATR20×1.5) middle band 769.3 / upper band 782.3 / lower band 756.4, ATR20=8.7; price tags and breaks above the upper band (channel position≈1.00). KDJ(9,3,3) K=77.8 / D=64.7 / J=104; J surged from around 50 in the night session straight through 100. EMA12 770.9 just crossed above EMA26 769.1 (diff +1.8); price is above EMA50 768.3 / EMA200 743.
On the contract side, it’s not hot: the last 21 periods’ funding rate average is about 0.0019% (rough annualized ~2.1%), and the latest period is 0—only 1 out of 21 has touched the ceiling. OI volume is +0.7% in 24h and +1.1% over 7 days. Retail accounts L/S is 2.21 (about 69% long), still higher than the big-holder position ratio 1.51 (about 60% long); the gap is about 0.70—so it doesn’t look like whales are chasing it right at the top.
Structurally, it has just cleared the prior low/high zone (~779). On the upside, first watch the swing high 785 and the 7-day high 790. On the downside, support is the high-volume area/around EMA50 near 768; below that is the raised low at 763. Invalidation would be a 4H close back below 763.
The indicators are already at the limit, but leverage isn’t following—was this a fake overheating driven by spot, or will the next leg rely on OI to catch up and surge? Which do you trust more?
$BNB #BNB #技术分析 #contract data
Current price is about 782.4 (24h +1.8%). 4H: Keltner (EMA20, ATR20×1.5) middle band 769.3 / upper band 782.3 / lower band 756.4, ATR20=8.7; price tags and breaks above the upper band (channel position≈1.00). KDJ(9,3,3) K=77.8 / D=64.7 / J=104; J surged from around 50 in the night session straight through 100. EMA12 770.9 just crossed above EMA26 769.1 (diff +1.8); price is above EMA50 768.3 / EMA200 743.
On the contract side, it’s not hot: the last 21 periods’ funding rate average is about 0.0019% (rough annualized ~2.1%), and the latest period is 0—only 1 out of 21 has touched the ceiling. OI volume is +0.7% in 24h and +1.1% over 7 days. Retail accounts L/S is 2.21 (about 69% long), still higher than the big-holder position ratio 1.51 (about 60% long); the gap is about 0.70—so it doesn’t look like whales are chasing it right at the top.
Structurally, it has just cleared the prior low/high zone (~779). On the upside, first watch the swing high 785 and the 7-day high 790. On the downside, support is the high-volume area/around EMA50 near 768; below that is the raised low at 763. Invalidation would be a 4H close back below 763.
The indicators are already at the limit, but leverage isn’t following—was this a fake overheating driven by spot, or will the next leg rely on OI to catch up and surge? Which do you trust more?
$BNB #BNB #技术分析 #contract data