THE HIDDEN MAP OF WHALES: Bear trap or Solana’s definitive breakout? 🎯📉
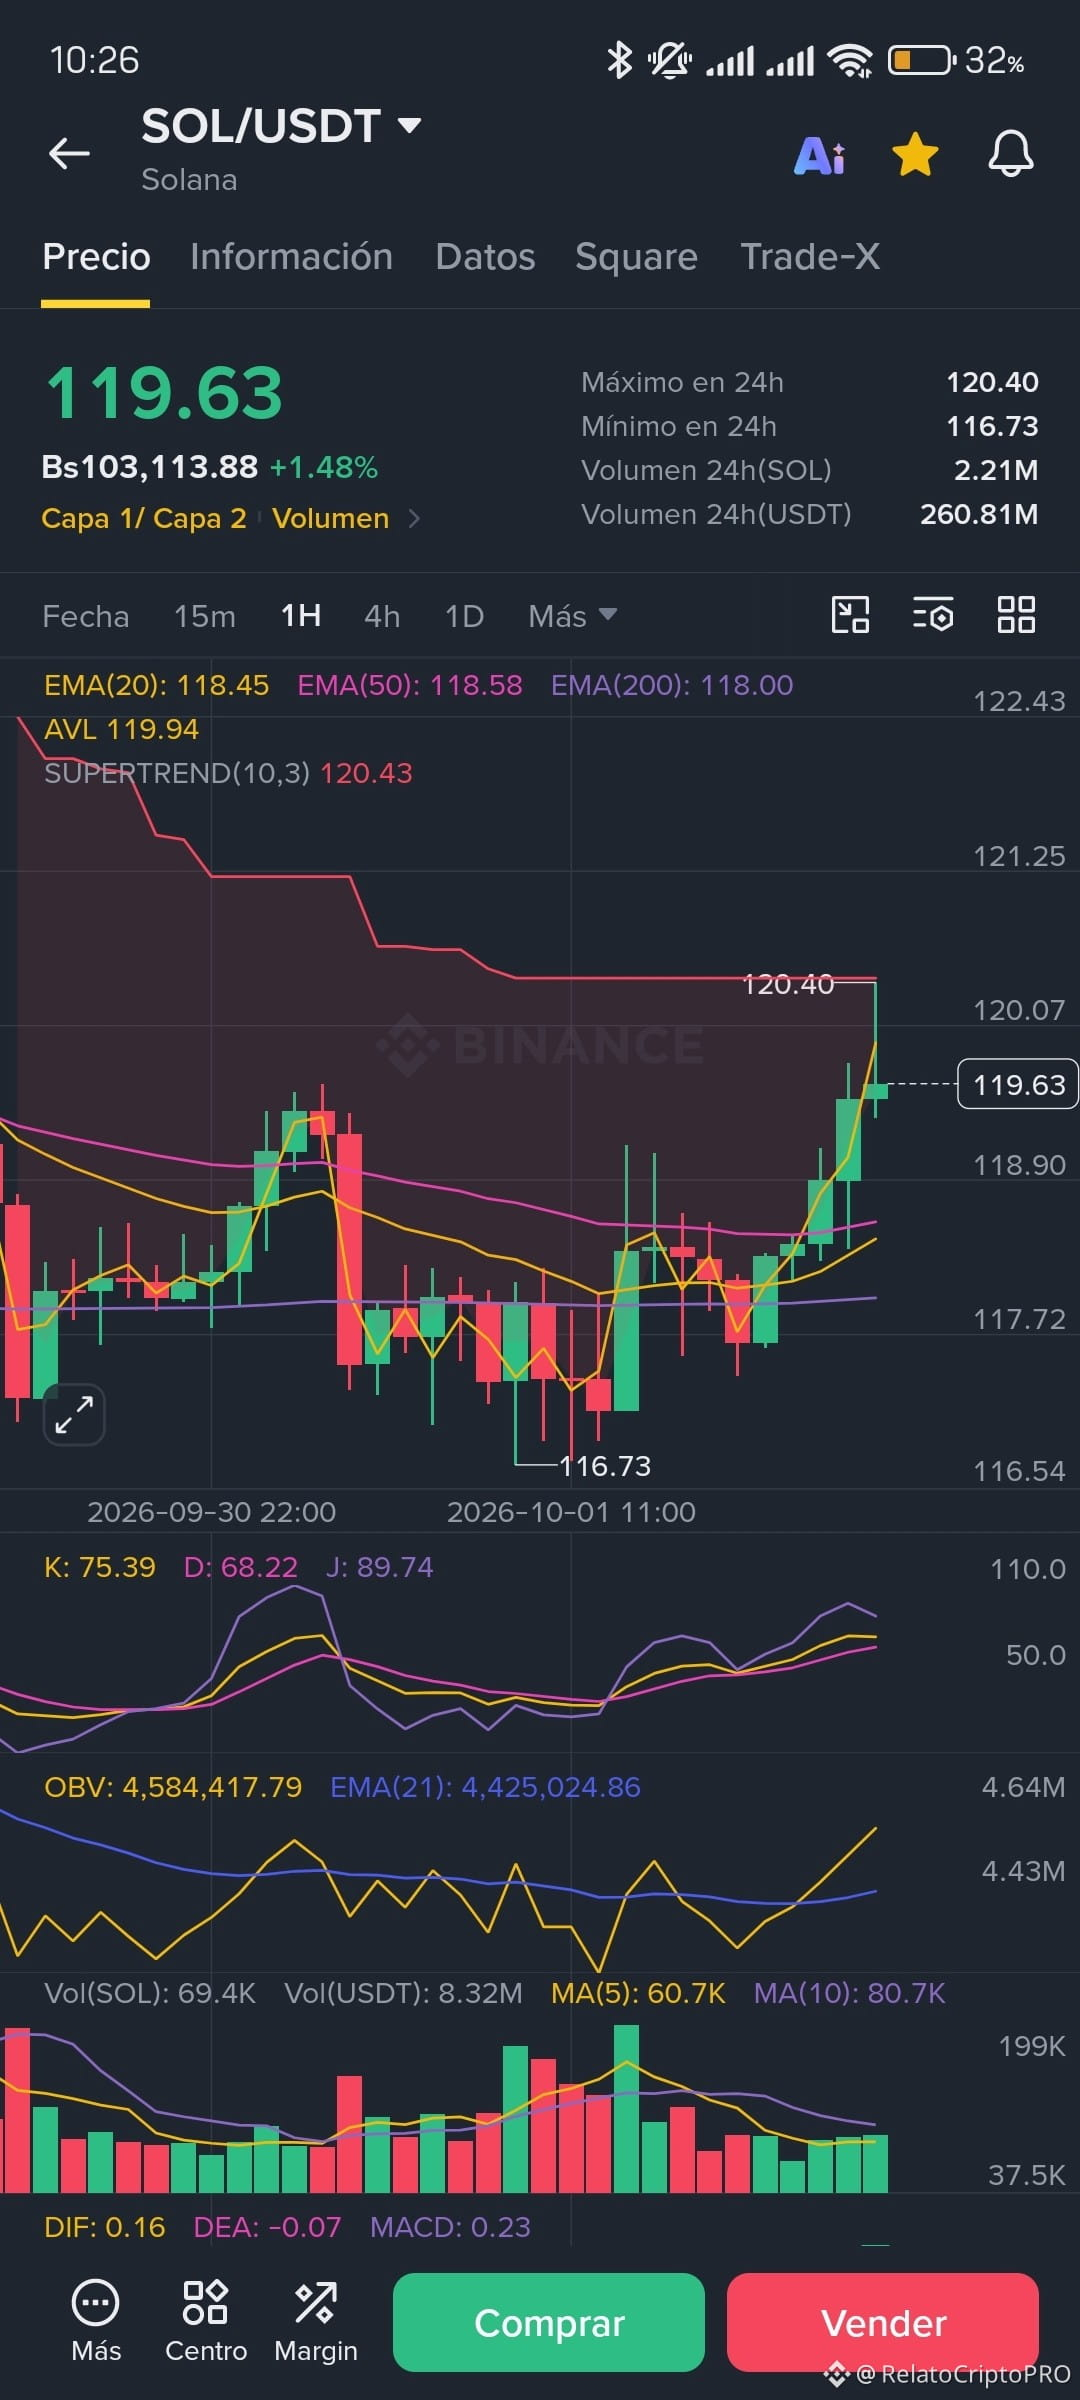
Solana is trading at 119.63 USDT, up +1.48% after a pinpoint test of support at 116.73 USDT and an intraday peak of 120.40 USDT. The market is breathing with tension, and the algorithms have already drawn the path.
Indicator Scan and Fibonacci:
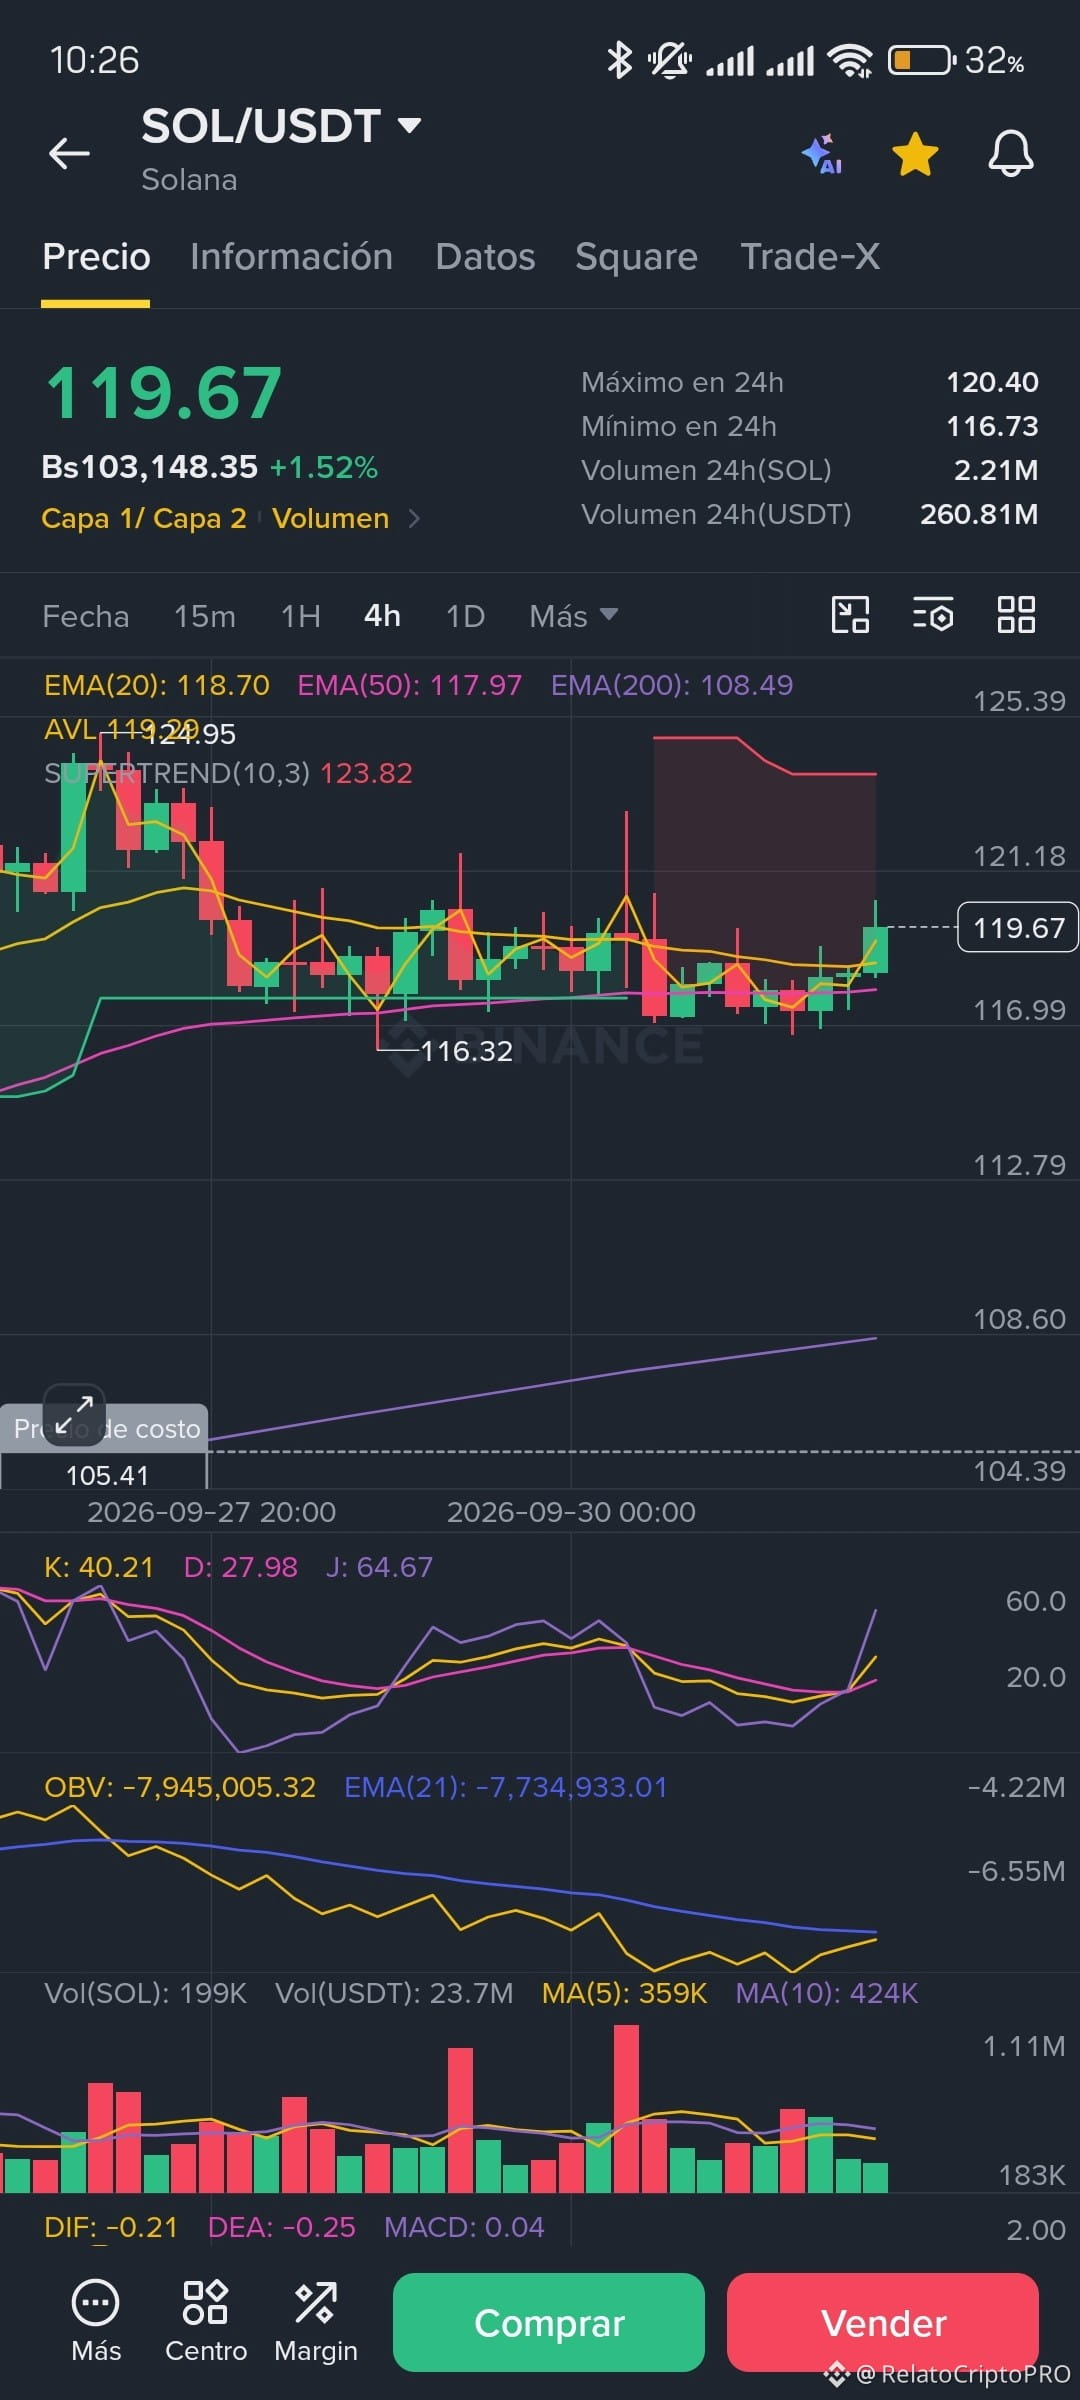
Moving Averages (1H / 4H): Price is converging dangerously toward the averages, with the 20-EMA at 118.45 USDT, the 50-EMA at 118.58 USDT, and the 200-EMA reinforcing the structure like concrete support at 118.00 USDT.
Oscillators and Volume: The KDJ shows the 'J' line at 89.74 with bullish pressure, the MACD stabilizes at 0.23, and institutional OBV reads 4,584,417.
Fibonacci Levels: The previous correction respected the golden retracement to the millimeter, confirming that the current accumulation is responding to a perfect market geometry.
The Order Book and the Trenches:
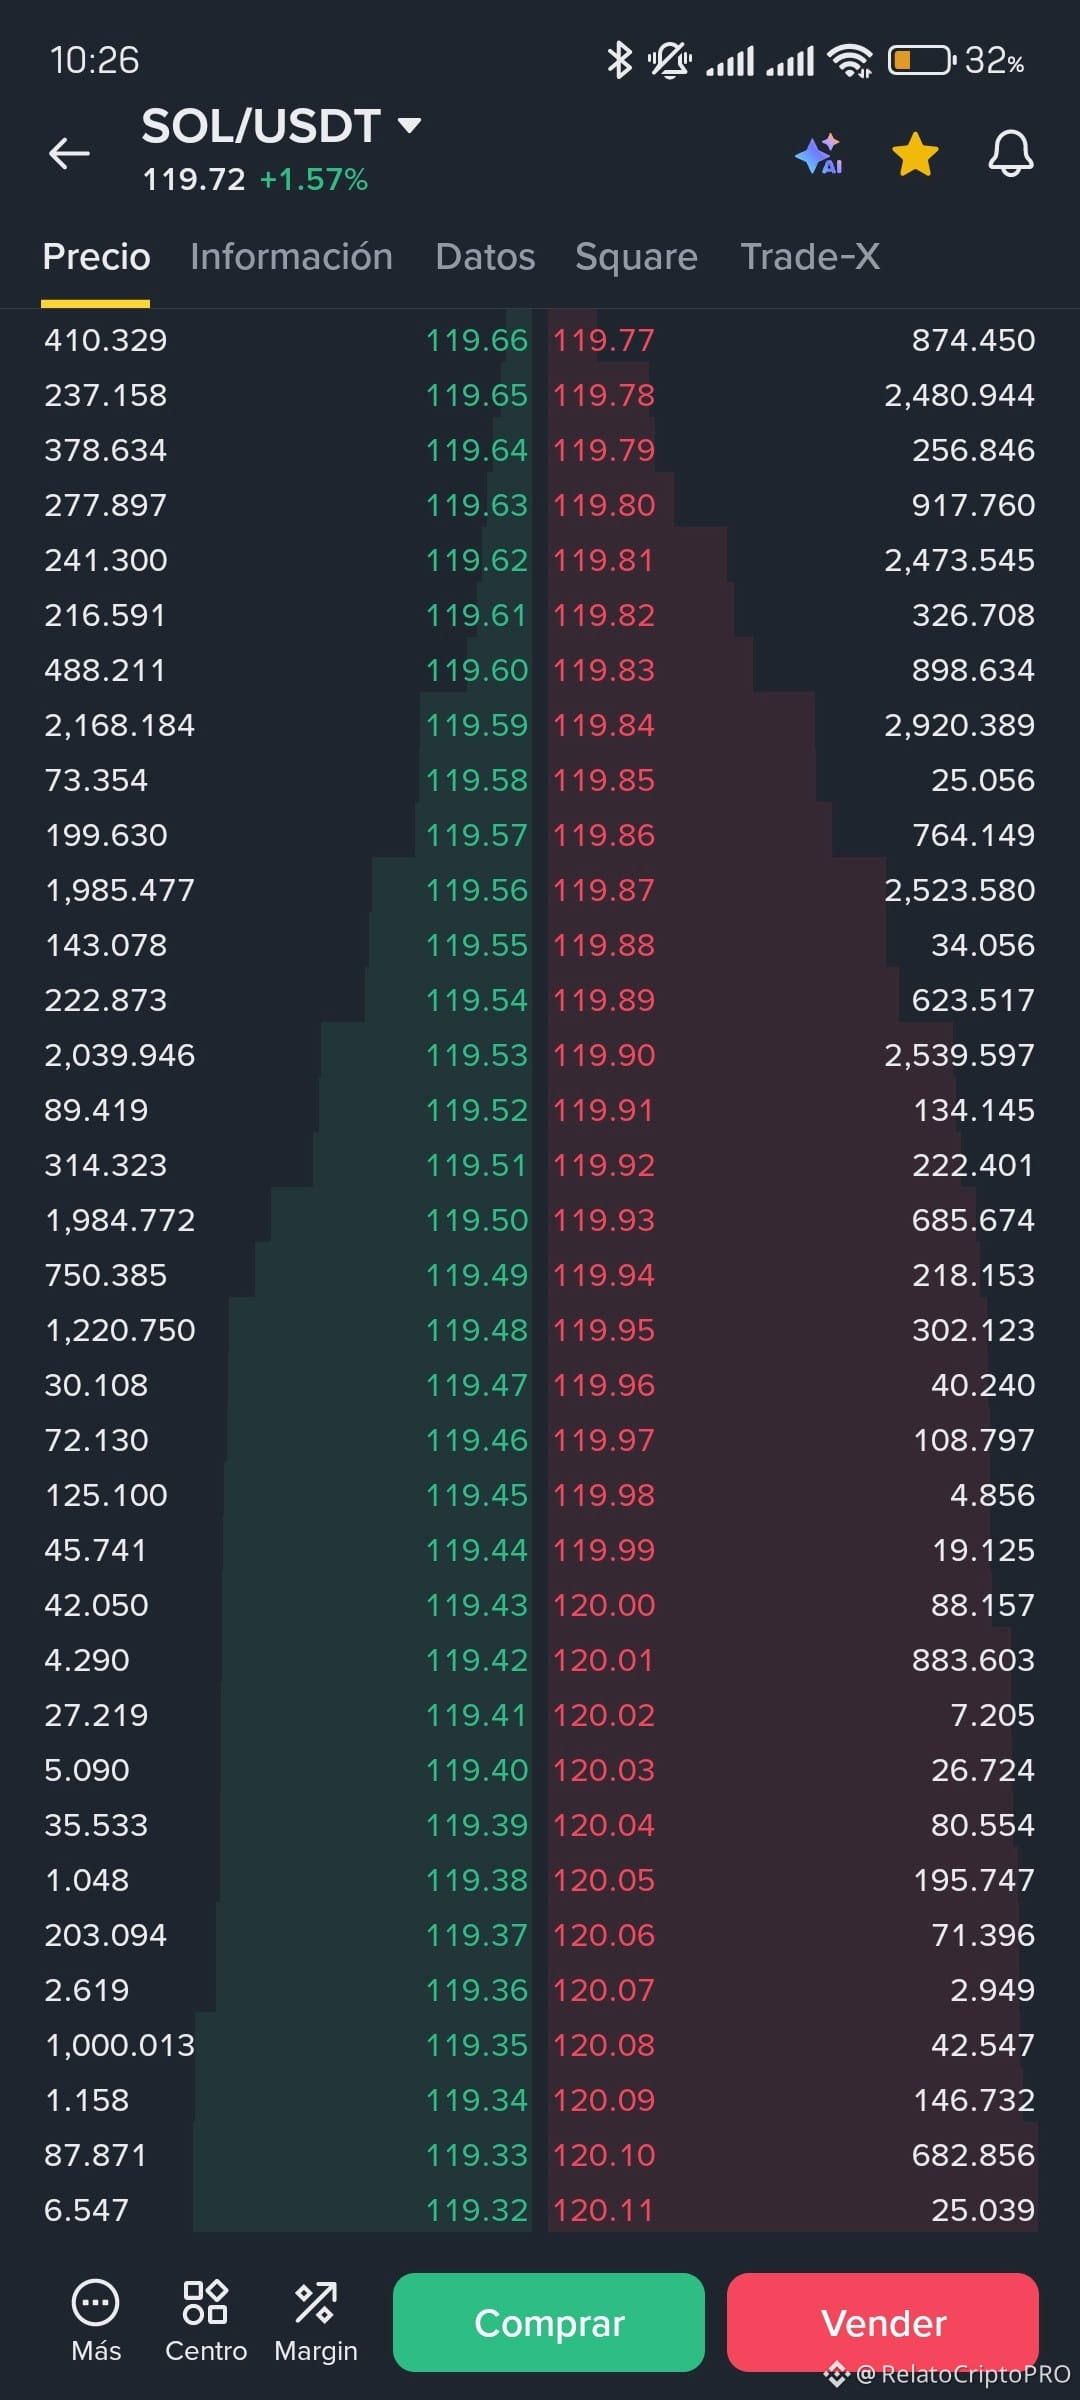
Binance depth is a real positional war. On the downside, buyers defend with massive absorption walls, highlighting huge blocks of 2,168,184 SOL at 119.59 USDT and 2,039,946 SOL at 119.53 USDT. On top, the sell resistance accumulates 2,920,389 SOL at 119.84 USDT and key blocks hovering around 120.00 USDT.
Sniper Zone:
Tactical Accumulation: 117.50 - 118.10 USDT (above the 200-EMA support).
Breakout Target: Break through the 120.40 USDT wall with volume to seek new highs.
Will the whales manage to break the ceiling, or will we see another liquidity sweep? I’m reading your comments! 🚀
RelatoCripto PRO
Solana is trading at 119.63 USDT, up +1.48% after a pinpoint test of support at 116.73 USDT and an intraday peak of 120.40 USDT. The market is breathing with tension, and the algorithms have already drawn the path.
Indicator Scan and Fibonacci:
Moving Averages (1H / 4H): Price is converging dangerously toward the averages, with the 20-EMA at 118.45 USDT, the 50-EMA at 118.58 USDT, and the 200-EMA reinforcing the structure like concrete support at 118.00 USDT.
Oscillators and Volume: The KDJ shows the 'J' line at 89.74 with bullish pressure, the MACD stabilizes at 0.23, and institutional OBV reads 4,584,417.
Fibonacci Levels: The previous correction respected the golden retracement to the millimeter, confirming that the current accumulation is responding to a perfect market geometry.
The Order Book and the Trenches:
Binance depth is a real positional war. On the downside, buyers defend with massive absorption walls, highlighting huge blocks of 2,168,184 SOL at 119.59 USDT and 2,039,946 SOL at 119.53 USDT. On top, the sell resistance accumulates 2,920,389 SOL at 119.84 USDT and key blocks hovering around 120.00 USDT.
Sniper Zone:
Tactical Accumulation: 117.50 - 118.10 USDT (above the 200-EMA support).
Breakout Target: Break through the 120.40 USDT wall with volume to seek new highs.
Will the whales manage to break the ceiling, or will we see another liquidity sweep? I’m reading your comments! 🚀
RelatoCripto PRO