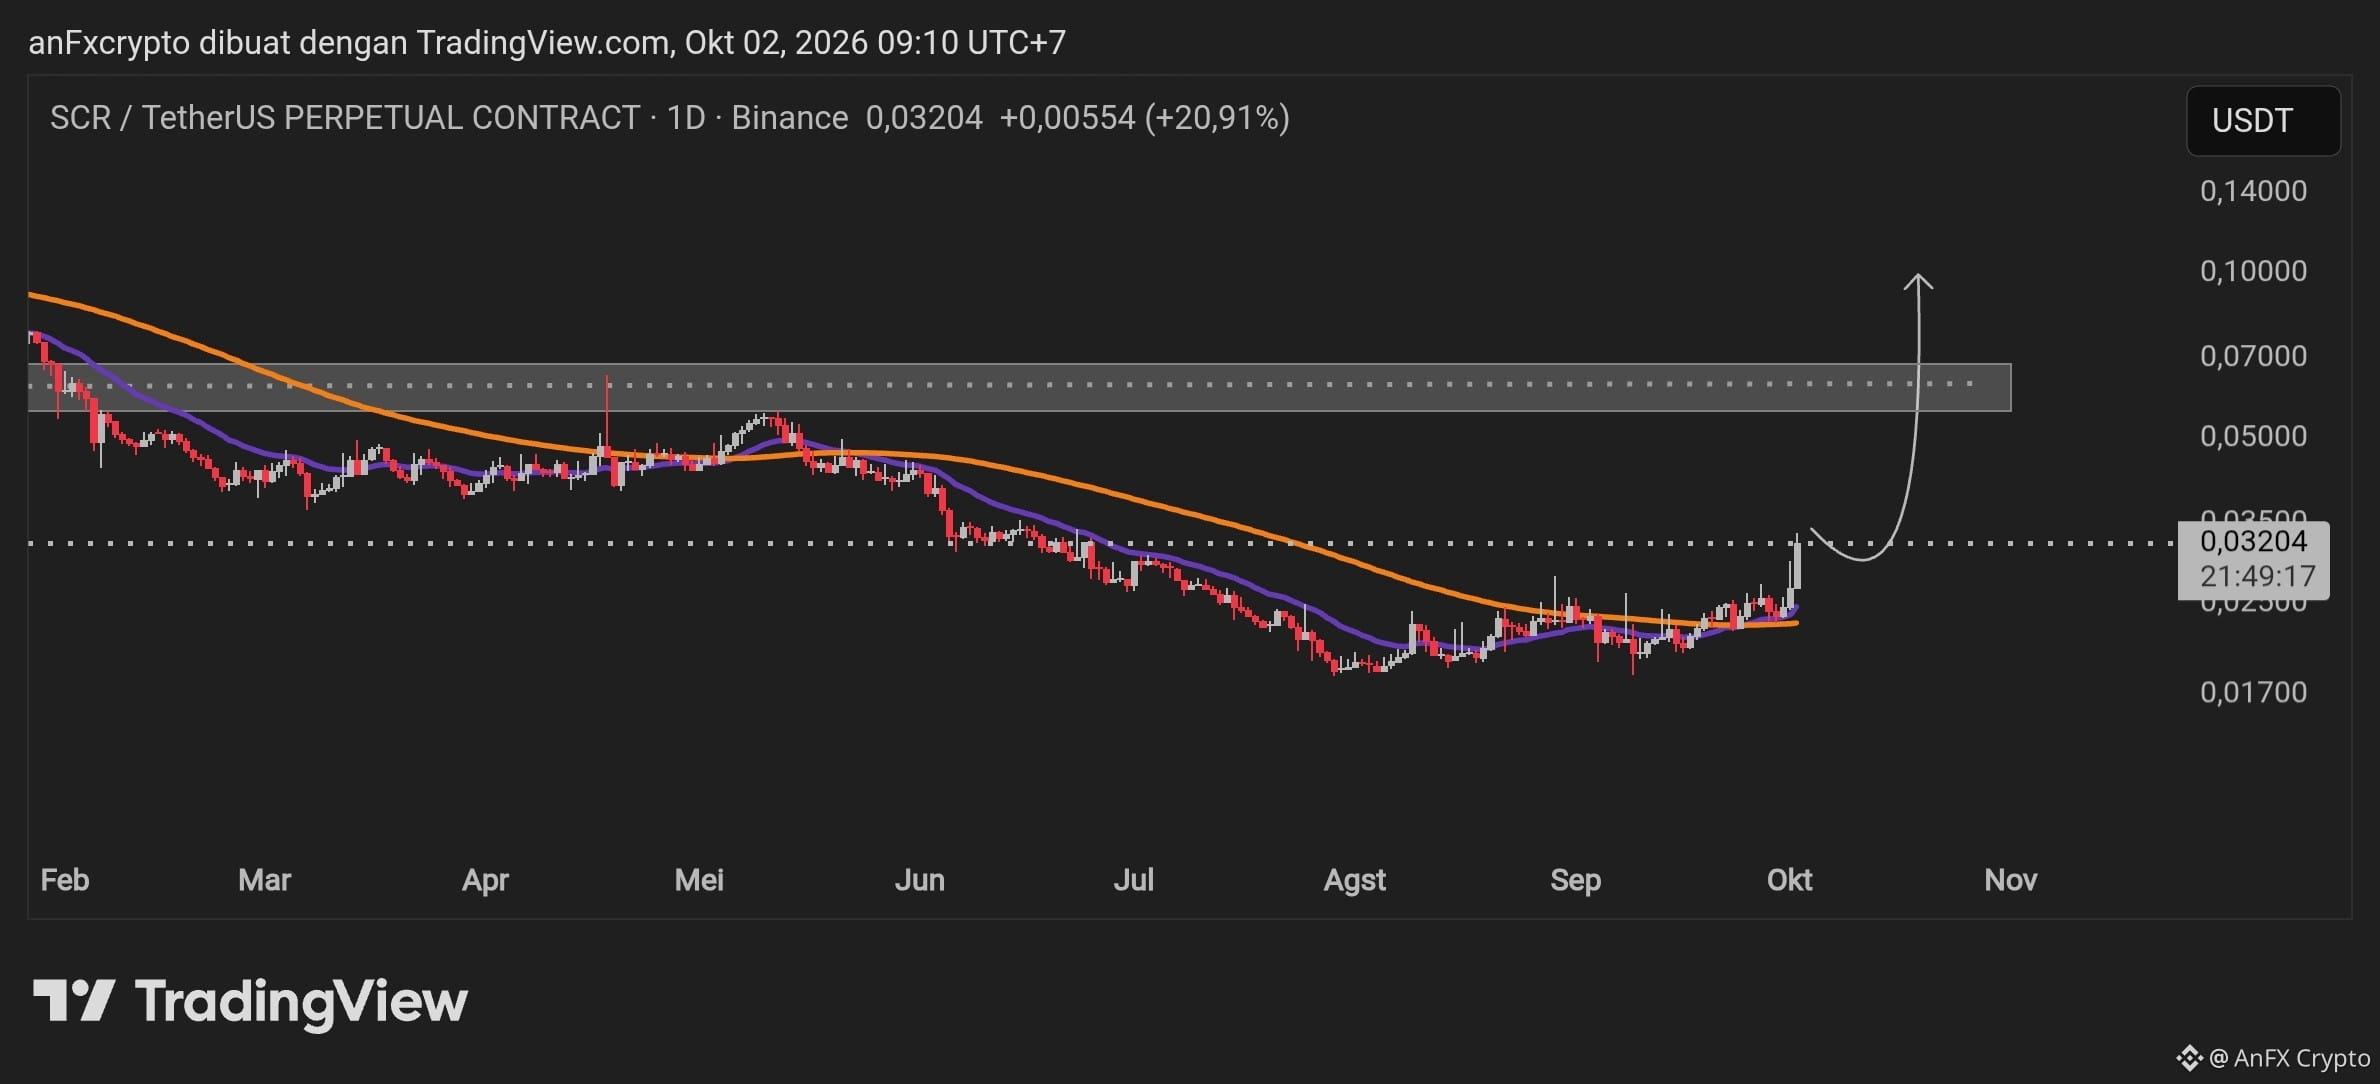
Here is an in-depth technical analysis along with a trading plan based on the daily chart $SCR /USDT Perpetual Contract:
Technical Analysis (1-Day Timeframe)
Market Structure & Bottoming Phase
After experiencing a long downtrend from the range of \$0.14000 to the All-Time Low in the \$0.01700 area, the price started forming a consolidation/accumulation pattern in the \$0.01700 – \$0.02300 range.
A strong bullish impulse (increase of +20,91\%) occurred, successfully breaking through the Moving Average/EMA line.
Price Movement Projection
According to the curve projection on the chart, this initial rise may experience a healthy correction (pullback/retest) toward the new support area around \$0.02700 – \$0.03000.
If the retest is successfully held above support/MA, the price has the potential to continue rallying toward the main resistance area (the shaded supply zone box) in the range \$0.05500 – \$0.07000 up to the psychological target at \$0.10000.
Trading Signals (Swing Trade)
Asset Pair: SCR/USDT (Perpetual)
Direction: BUY / LONG (Wait for Retest)
Entry Zone (Limit Buy): \$0.02700 – \$0.03000 (Waiting for a limited correction back to the breakout/EMA area)
Stop Loss (SL): \$0.02250 (Below the swing low and the Moving Average line)
Take Profit 1 (TP 1): \$0.05000 (Local resistance area / lower boundary of the supply zone)
Take Profit 2 (TP 2): \$0.06800 (Main target inside the gray box / supply zone)
Take Profit 3 (TP 3): \$0.10000 (Extension projection target / major direction reversal)
Risk Management Notes
Risk to Reward Ratio (RRR): Ranging from 1 : 3.5 to 1 : 6, providing a very favorable risk profile probability for swing trading.
Execution Strategy: Avoid FOMO buying at the current market price (\approx \$0.03204). Let the price retest the entry zone first to minimize drawdown.
Capital Allocation: Limit maximum risk to 1% – 2% of your total portfolio equity on this position.
Technical Analysis (1-Day Timeframe)
Market Structure & Bottoming Phase
After experiencing a long downtrend from the range of \$0.14000 to the All-Time Low in the \$0.01700 area, the price started forming a consolidation/accumulation pattern in the \$0.01700 – \$0.02300 range.
A strong bullish impulse (increase of +20,91\%) occurred, successfully breaking through the Moving Average/EMA line.
Price Movement Projection
According to the curve projection on the chart, this initial rise may experience a healthy correction (pullback/retest) toward the new support area around \$0.02700 – \$0.03000.
If the retest is successfully held above support/MA, the price has the potential to continue rallying toward the main resistance area (the shaded supply zone box) in the range \$0.05500 – \$0.07000 up to the psychological target at \$0.10000.
Trading Signals (Swing Trade)
Asset Pair: SCR/USDT (Perpetual)
Direction: BUY / LONG (Wait for Retest)
Entry Zone (Limit Buy): \$0.02700 – \$0.03000 (Waiting for a limited correction back to the breakout/EMA area)
Stop Loss (SL): \$0.02250 (Below the swing low and the Moving Average line)
Take Profit 1 (TP 1): \$0.05000 (Local resistance area / lower boundary of the supply zone)
Take Profit 2 (TP 2): \$0.06800 (Main target inside the gray box / supply zone)
Take Profit 3 (TP 3): \$0.10000 (Extension projection target / major direction reversal)
Risk Management Notes
Risk to Reward Ratio (RRR): Ranging from 1 : 3.5 to 1 : 6, providing a very favorable risk profile probability for swing trading.
Execution Strategy: Avoid FOMO buying at the current market price (\approx \$0.03204). Let the price retest the entry zone first to minimize drawdown.
Capital Allocation: Limit maximum risk to 1% – 2% of your total portfolio equity on this position.