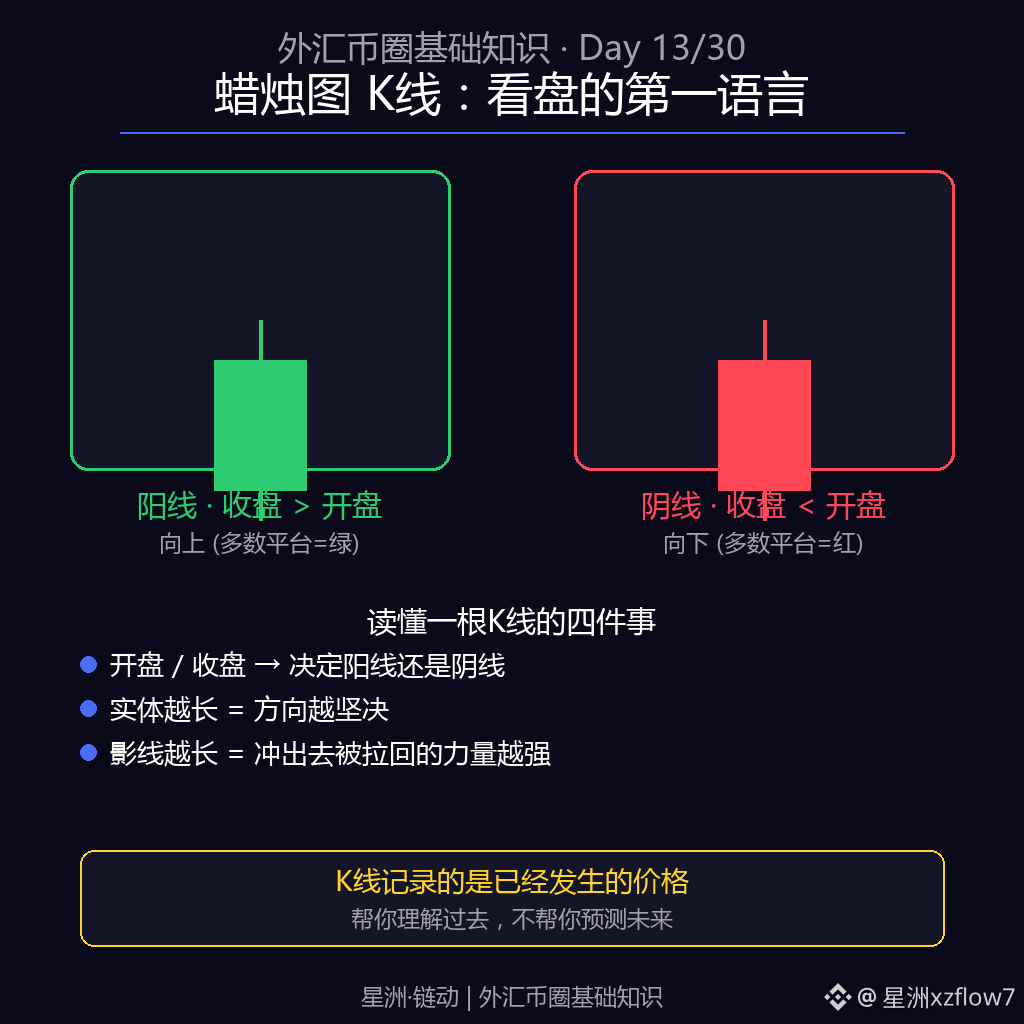
A candlestick chart, also known as a K-line, is the first language traders use to read the market. One K-line explains four things: the opening price, closing price, highest price, and lowest price.
If the closing price is higher than the opening price, it’s a bullish (positive) candle, and most platforms display it in green to indicate an upward move; if the closing price is lower than the opening price, it’s a bearish (negative) candle, shown in red to indicate a decline.
The longer the real body, the more decisive the direction; the longer the upper and lower wicks, the stronger the force that drove the price outward and then pulled it back.
The meaning of a single K-line is limited. The patterns formed by consecutive K-lines (such as a long upper wick or a doji) are what have greater reference value.
Remember: K-lines record prices that have already happened. They help you understand the past, not predict the future. This chart-reading “language” is used in both the FX and crypto markets.
The market involves risk—trade with caution. The above content is for general educational purposes and does not constitute investment advice.
井外汇 井Forex 井K线 井蜡烛图 井技术分析 井基础知识
If the closing price is higher than the opening price, it’s a bullish (positive) candle, and most platforms display it in green to indicate an upward move; if the closing price is lower than the opening price, it’s a bearish (negative) candle, shown in red to indicate a decline.
The longer the real body, the more decisive the direction; the longer the upper and lower wicks, the stronger the force that drove the price outward and then pulled it back.
The meaning of a single K-line is limited. The patterns formed by consecutive K-lines (such as a long upper wick or a doji) are what have greater reference value.
Remember: K-lines record prices that have already happened. They help you understand the past, not predict the future. This chart-reading “language” is used in both the FX and crypto markets.
The market involves risk—trade with caution. The above content is for general educational purposes and does not constitute investment advice.
井外汇 井Forex 井K线 井蜡烛图 井技术分析 井基础知识