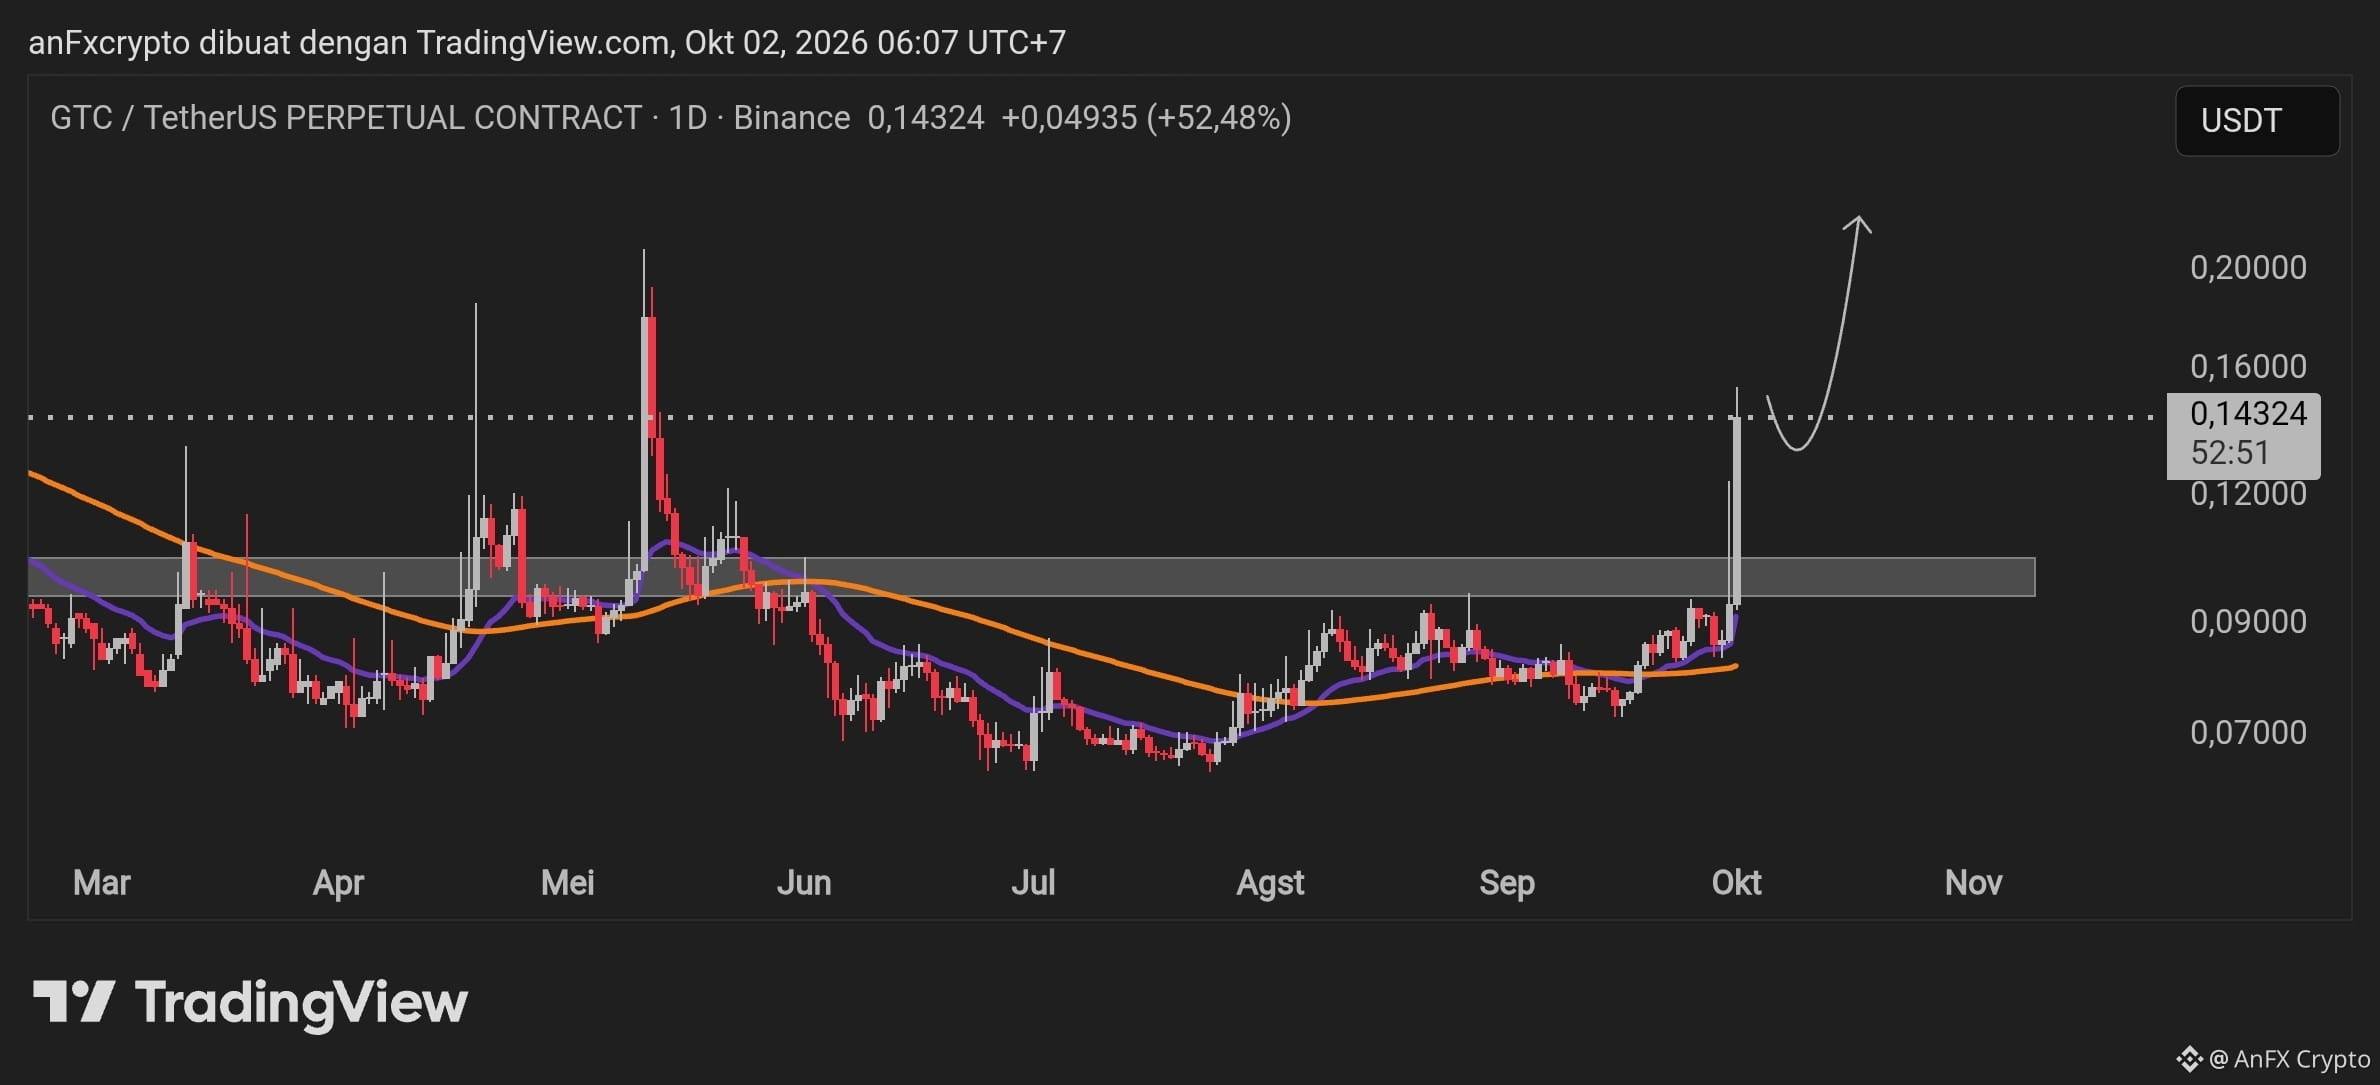
Chart $GTC /USDT (Daily / 1D) shows a significant price surge (bullish breakout) after a long consolidation phase.
Technical Analysis
Market Structure & Breakout:
Structure: There was a Change of Character (CHoCH) from a sideways trend into bullish continuation.
Resistance Flip: The consolidation range at $0.09000 – $0.10500, which previously acted as strong resistance, has now been successfully broken out (breakout) with high volume and momentum (+52%).
Current Price Conditions:
The current price is around $0.14324. Placing a direct buy (market order) on the green candle that is surging high is very risky and may trigger FOMO and chasing the market.
Projection Scenario (According to the Chart):
The most ideal scenario is Breakout – Retest – Continuation. We are waiting for a pullback or a healthy correction into the Demand/Support Flip area before continuing the rise toward targets of $0.20000+.
Signals & Trading Plan (GTC/USDT Perpetual)
Bias: Bullish (Buy on Retest Strategy)
Entry Area (Limit Buy): $0.12000 – $0.12800 (Wait for a correction into the retest area)
Stop Loss (SL): $0.10200 (Below the upper bound of the support flip area)
Take Profit (TP):
TP 1: $0.16000 (Latest swing high)
TP 2: $0.20000 (Main resistance target)
Risk-to-Reward Ratio (RRR): ~ 1 : 3
Risk Management Notes
Leverage: It is recommended to use low leverage (2x – 5x) due to the extremely high volatility after a move of >50%.
Position Sizing: Risk no more than 1% – 2% of total account equity.
Discipline: If the price does not pull back and instead continues rising immediately without entering the target entry area, let that opportunity pass—don’t force an entry at the top.
Technical Analysis
Market Structure & Breakout:
Structure: There was a Change of Character (CHoCH) from a sideways trend into bullish continuation.
Resistance Flip: The consolidation range at $0.09000 – $0.10500, which previously acted as strong resistance, has now been successfully broken out (breakout) with high volume and momentum (+52%).
Current Price Conditions:
The current price is around $0.14324. Placing a direct buy (market order) on the green candle that is surging high is very risky and may trigger FOMO and chasing the market.
Projection Scenario (According to the Chart):
The most ideal scenario is Breakout – Retest – Continuation. We are waiting for a pullback or a healthy correction into the Demand/Support Flip area before continuing the rise toward targets of $0.20000+.
Signals & Trading Plan (GTC/USDT Perpetual)
Bias: Bullish (Buy on Retest Strategy)
Entry Area (Limit Buy): $0.12000 – $0.12800 (Wait for a correction into the retest area)
Stop Loss (SL): $0.10200 (Below the upper bound of the support flip area)
Take Profit (TP):
TP 1: $0.16000 (Latest swing high)
TP 2: $0.20000 (Main resistance target)
Risk-to-Reward Ratio (RRR): ~ 1 : 3
Risk Management Notes
Leverage: It is recommended to use low leverage (2x – 5x) due to the extremely high volatility after a move of >50%.
Position Sizing: Risk no more than 1% – 2% of total account equity.
Discipline: If the price does not pull back and instead continues rising immediately without entering the target entry area, let that opportunity pass—don’t force an entry at the top.