#Mega
Momentum and Liquidity Indicators
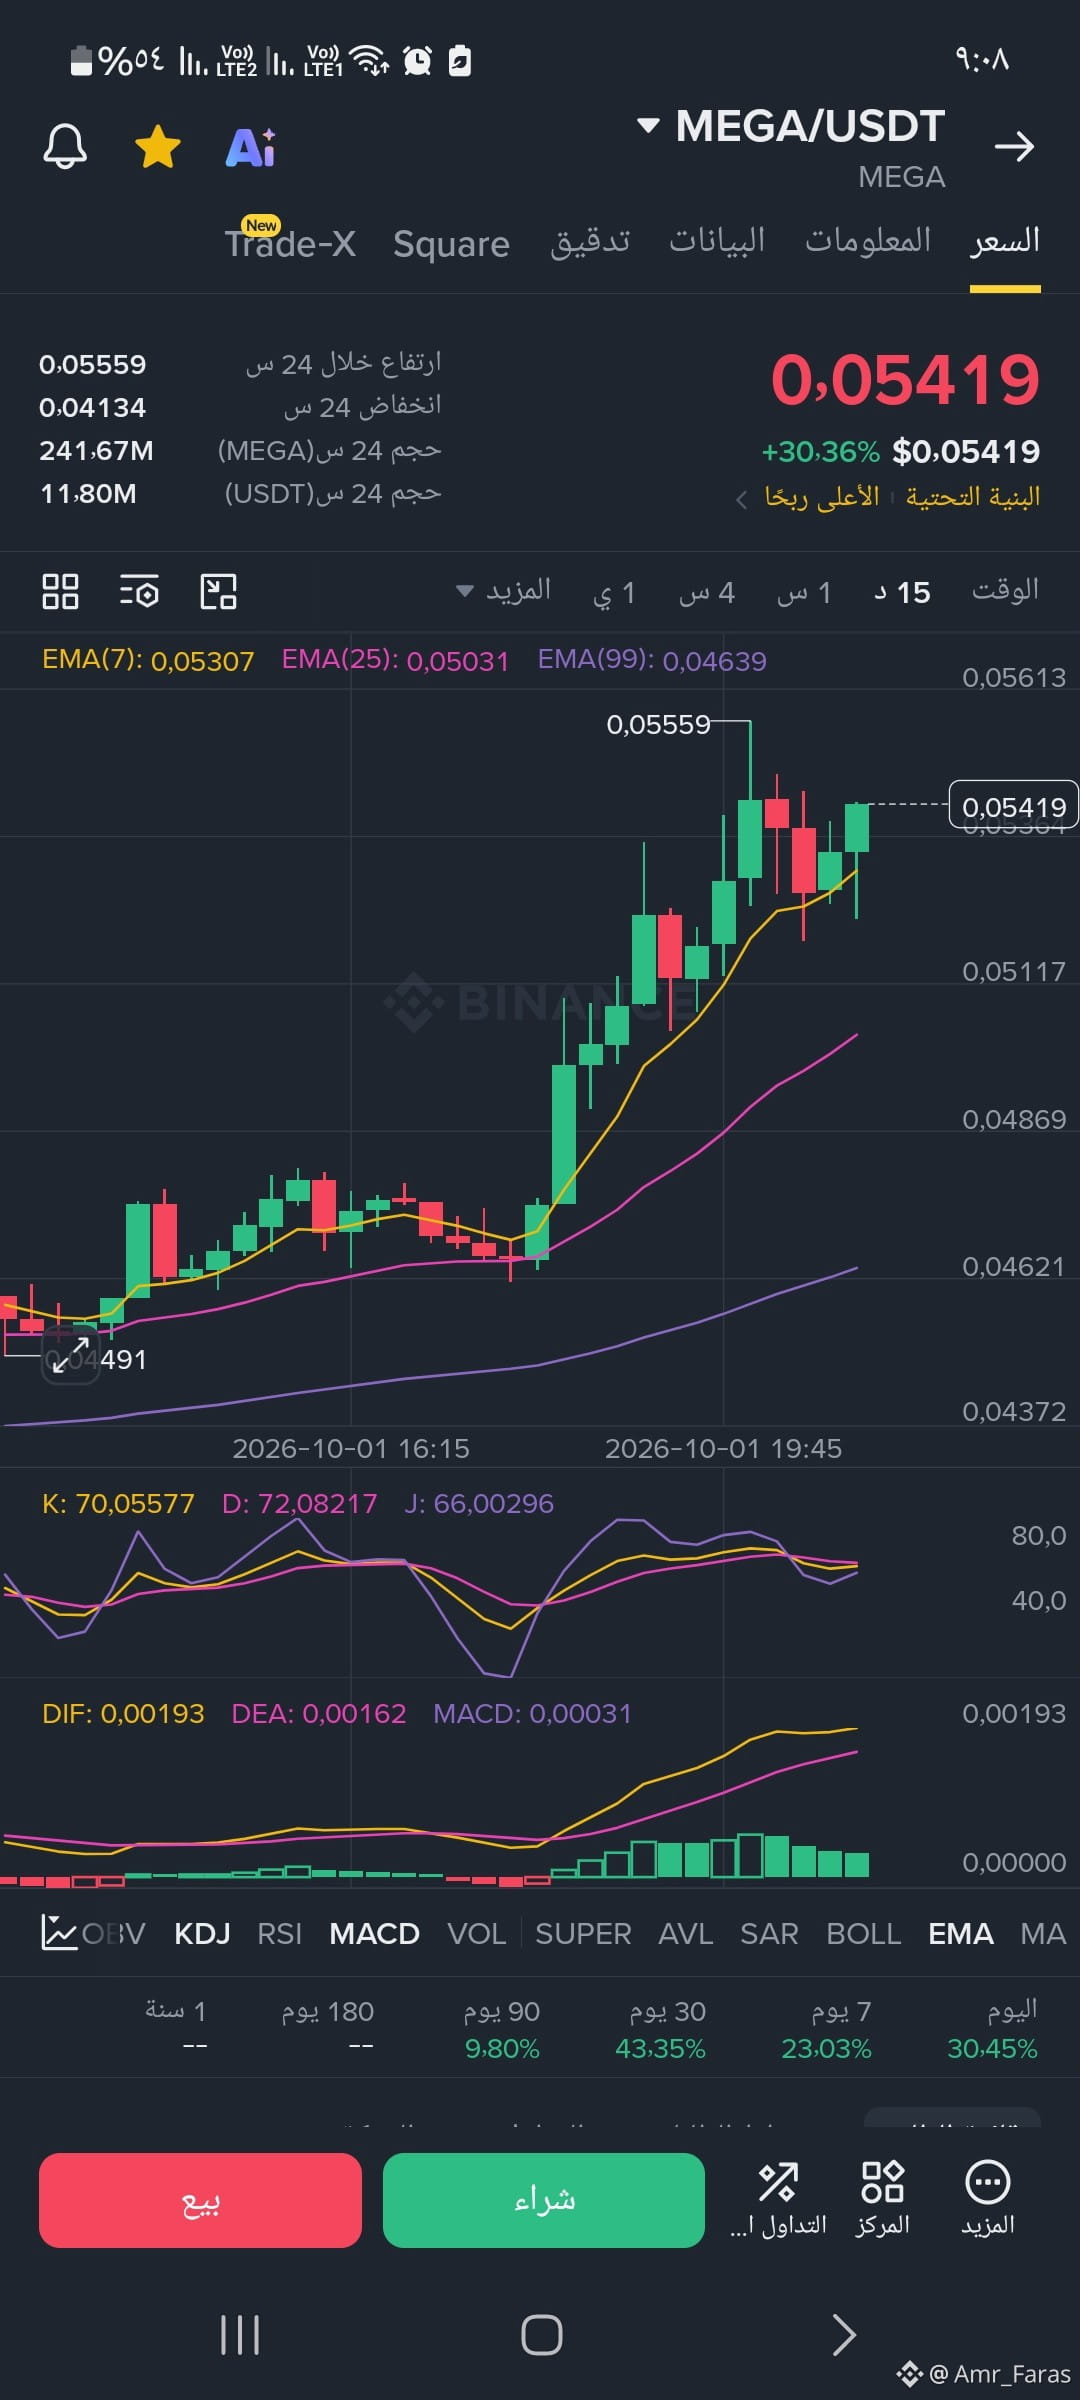
• Stochastic Oscillator (KDJ): The indicator lines converge at the top of the range (K: 70.05 and D: 72.08). This suggests the price is approaching an overbought zone, meaning there may be a temporary cool-down or a slight pullback to catch its breath before any further rise.
• MACD Indicator: The DIF line (0.00193) is above the DEA line (0.00162), with the Histogram bars in the positive green range (0.00031). This supports the continued dominance of buyers at present.
3. Price Movement Summary (Over the Past Few Days)
The performance table below the chart shows the accelerated coin growth:
• Daily Performance (Today): Strong rise of 30.45%.
• Over 7 days: Up 23.03% (indicating that the biggest increase is concentrated today).
• Over 30 days: Notable growth of 43.35%.
Momentum and Liquidity Indicators
• Stochastic Oscillator (KDJ): The indicator lines converge at the top of the range (K: 70.05 and D: 72.08). This suggests the price is approaching an overbought zone, meaning there may be a temporary cool-down or a slight pullback to catch its breath before any further rise.
• MACD Indicator: The DIF line (0.00193) is above the DEA line (0.00162), with the Histogram bars in the positive green range (0.00031). This supports the continued dominance of buyers at present.
3. Price Movement Summary (Over the Past Few Days)
The performance table below the chart shows the accelerated coin growth:
• Daily Performance (Today): Strong rise of 30.45%.
• Over 7 days: Up 23.03% (indicating that the biggest increase is concentrated today).
• Over 30 days: Notable growth of 43.35%.