📊 #ZECUSDT — 2H TECHNICAL ANALYSIS #zec
🔥 VJ ANALYSIS | TREND HUNTER
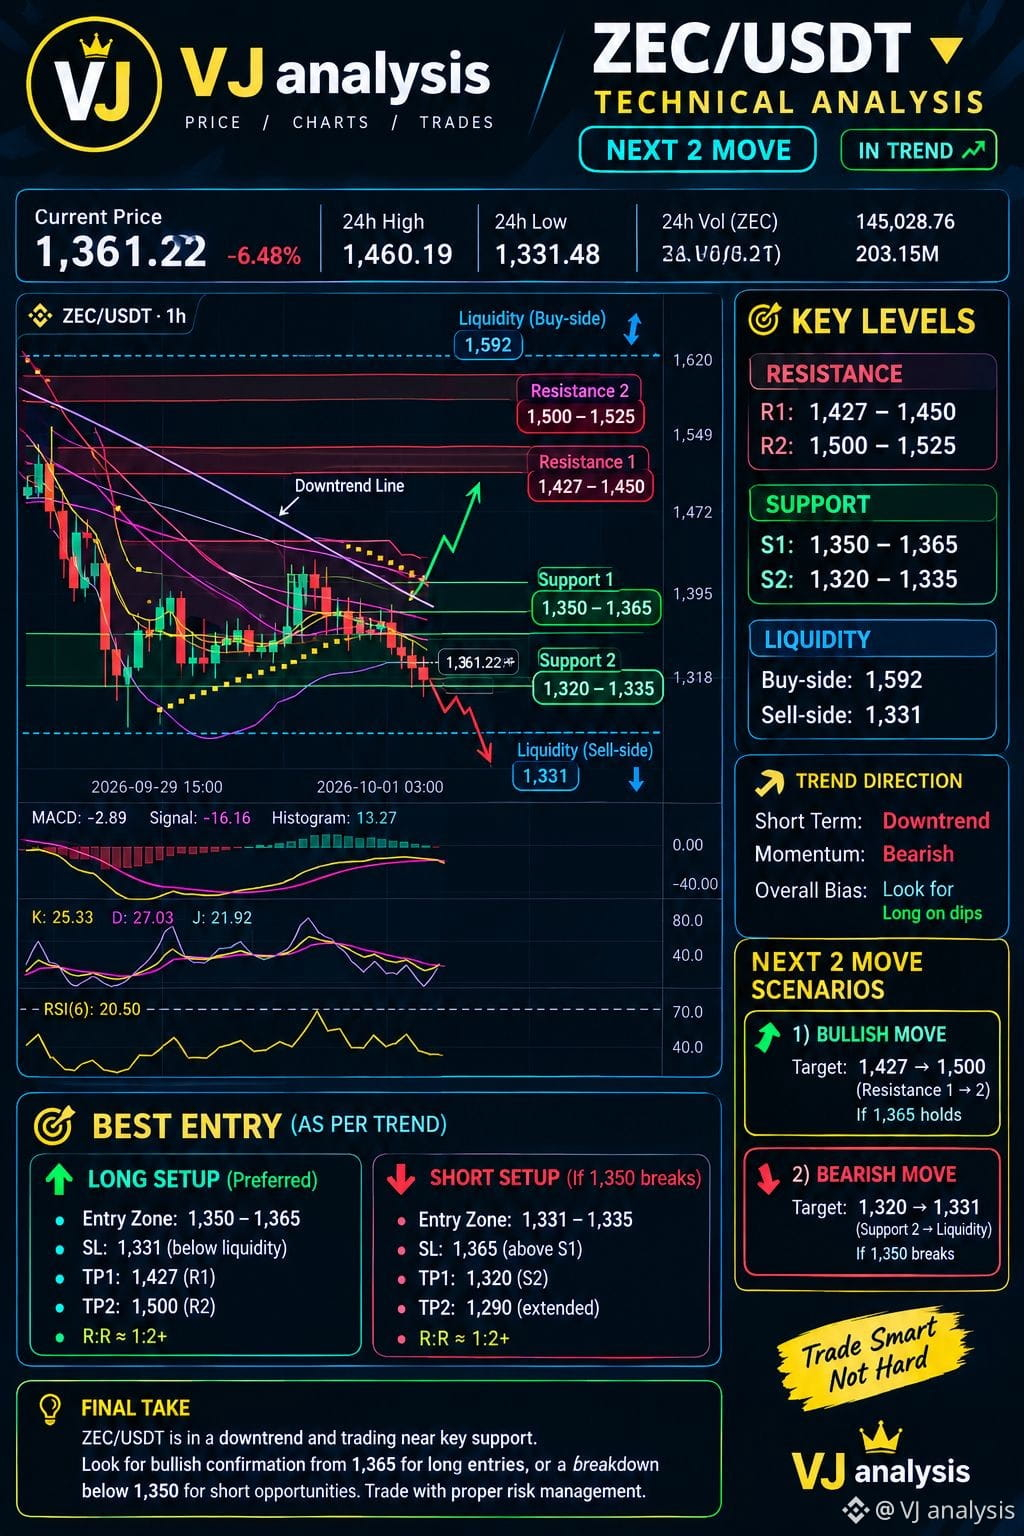
ZEC/USDT is currently trading around 1,361, down sharply and sitting near an important support zone. The 2H structure remains bearish, with price below major moving averages and momentum still weak. RSI is near 20, showing oversold conditions, so a short-term relief bounce is possible.
🎯 KEY SUPPORTS
🟢 S1: 1,350–1,365
🟢 S2: 1,320–1,335
⚡ Sell-side liquidity: ~1,331
🚧 KEY RESISTANCES
🔴 R1: 1,427–1,450
🔴 R2: 1,500–1,525
💧 Buy-side liquidity: ~1,592
🚀 NEXT 2 MOVES
1️⃣ BULLISH SCENARIO:
If 1,350–1,365 holds and buyers reclaim nearby resistance, a relief move toward 1,427–1,450 could develop. A strong breakout may open the path toward 1,500.
📉 2️⃣ BEARISH SCENARIO:
If 1,350 breaks with confirmation, price may sweep lower liquidity around 1,331, with 1,320–1,335 becoming the next major zone.
🎯 BEST ENTRY:
Long setup: 1,350–1,365 after confirmation.
Short setup: below 1,350 after a confirmed breakdown.
⚠️ Manage risk and wait for confirmation before entering.
VJ ANALYSIS 👑 | TRADE SMART, NOT HARD. #ZECUSDT
🔥 VJ ANALYSIS | TREND HUNTER
ZEC/USDT is currently trading around 1,361, down sharply and sitting near an important support zone. The 2H structure remains bearish, with price below major moving averages and momentum still weak. RSI is near 20, showing oversold conditions, so a short-term relief bounce is possible.
🎯 KEY SUPPORTS
🟢 S1: 1,350–1,365
🟢 S2: 1,320–1,335
⚡ Sell-side liquidity: ~1,331
🚧 KEY RESISTANCES
🔴 R1: 1,427–1,450
🔴 R2: 1,500–1,525
💧 Buy-side liquidity: ~1,592
🚀 NEXT 2 MOVES
1️⃣ BULLISH SCENARIO:
If 1,350–1,365 holds and buyers reclaim nearby resistance, a relief move toward 1,427–1,450 could develop. A strong breakout may open the path toward 1,500.
📉 2️⃣ BEARISH SCENARIO:
If 1,350 breaks with confirmation, price may sweep lower liquidity around 1,331, with 1,320–1,335 becoming the next major zone.
🎯 BEST ENTRY:
Long setup: 1,350–1,365 after confirmation.
Short setup: below 1,350 after a confirmed breakdown.
⚠️ Manage risk and wait for confirmation before entering.
VJ ANALYSIS 👑 | TRADE SMART, NOT HARD. #ZECUSDT