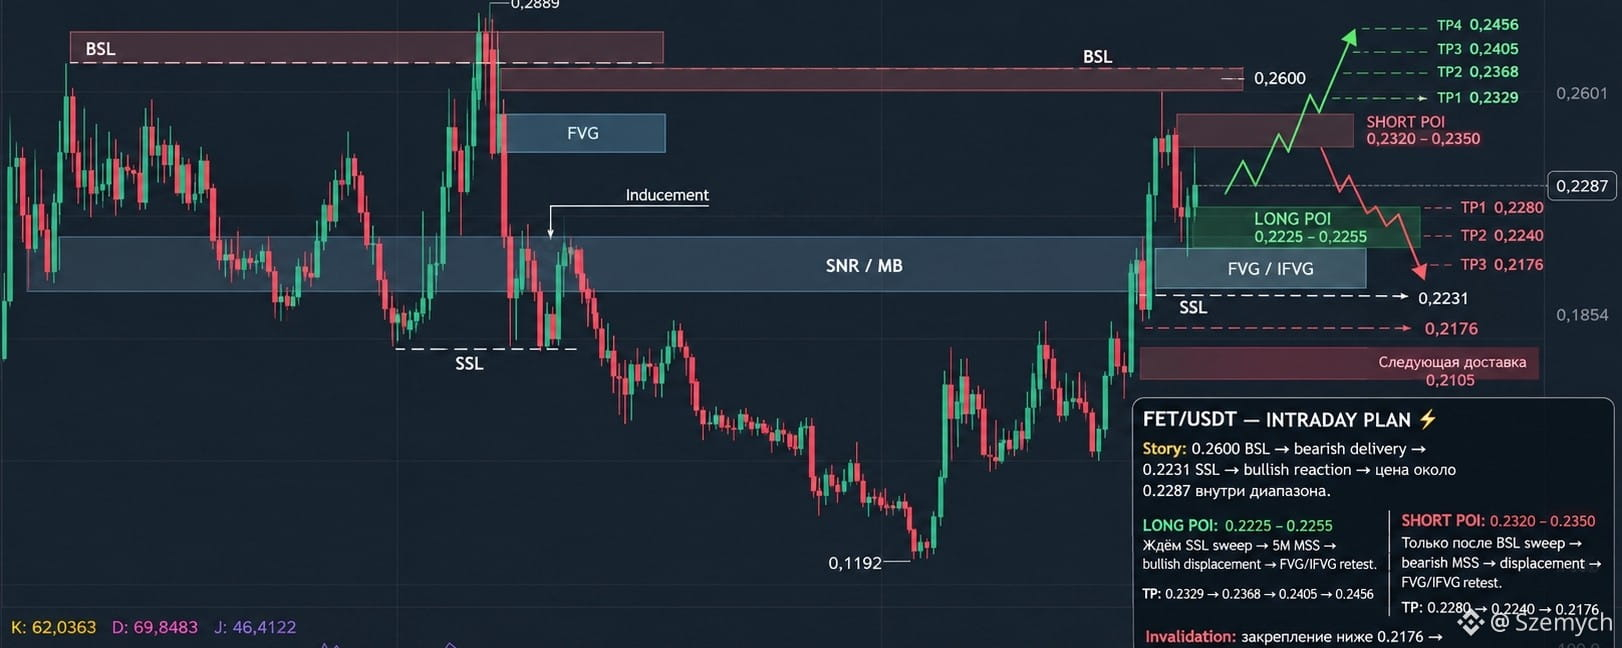

#FET FET/USDT — analysis...
Based on the provided charts D1 → H4 → H1 → M15 → M5, the structure is currently in the zone of choosing the next liquidity. Since the price is around 0.2287, entering at the current price without a sweep + MSS is not advisable.
1. D1 — HTF Narrative
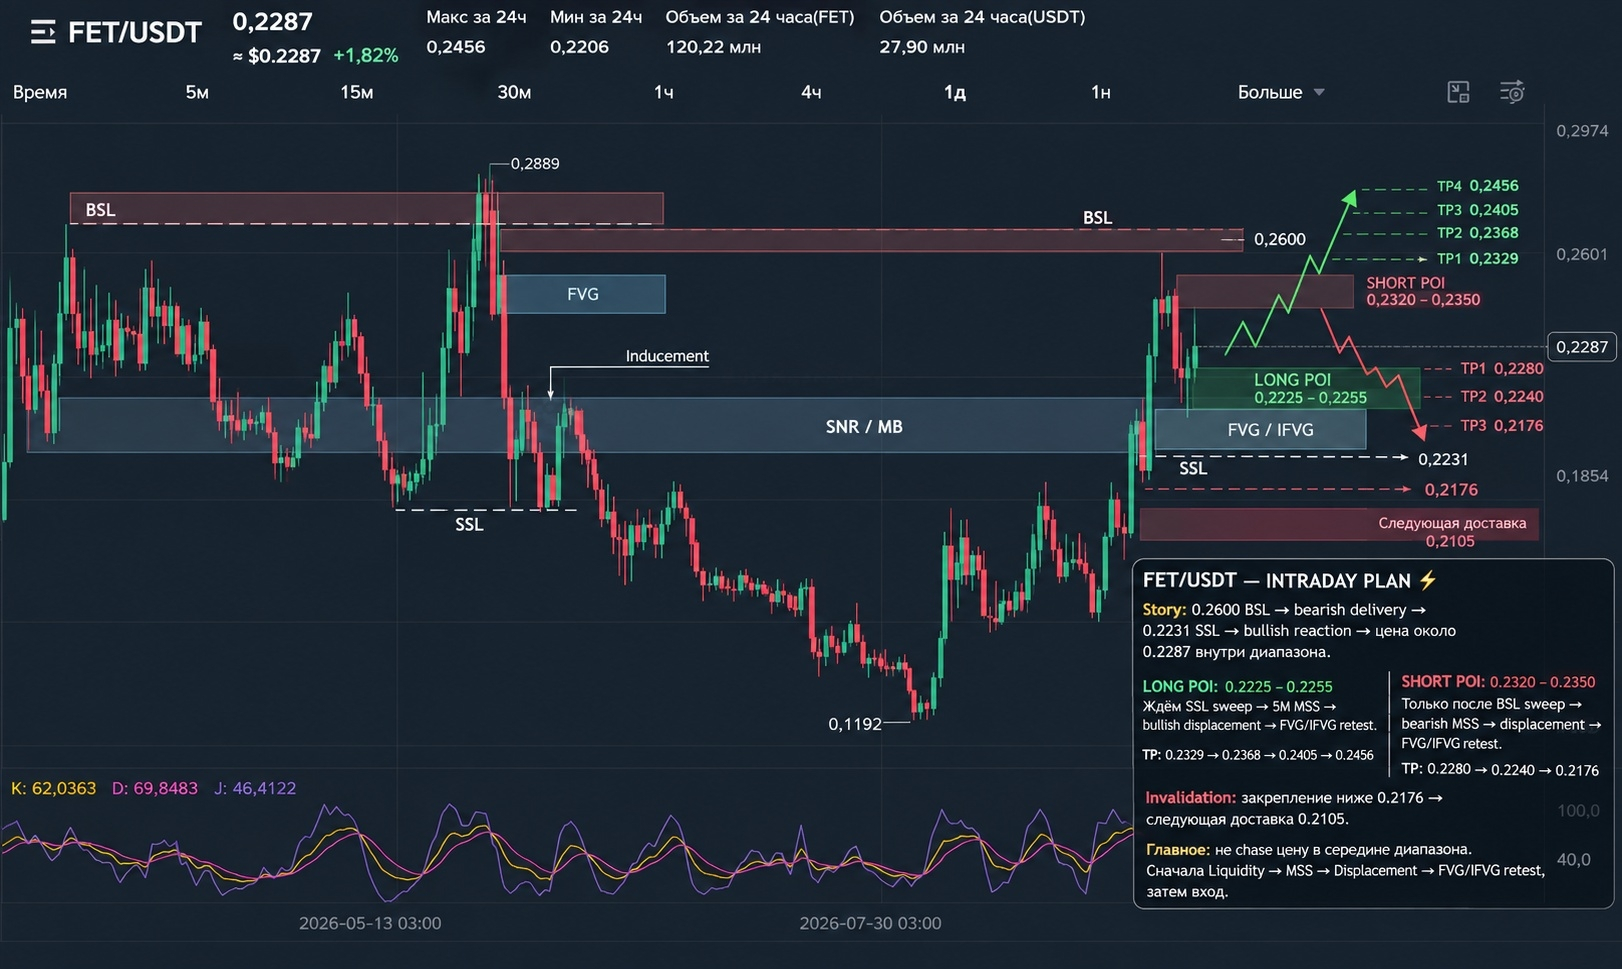
Key story:
0.1192 SSL → strong bullish delivery → 0.2600 BSL → downward reaction → current consolidation around 0.2287.
After the move away from 0.1192, the market formed a strong upside impulse up to 0.2600. Now the price is roughly in the middle of the subsequent range.
Key HTF levels:
🔴 0.2600 — major BSL / HTF high
🟠 0.240–0.246 — internal BSL / supply zone
⚪ 0.217–0.220 — key support
🟢 0.210–0.214 — next downside liquidity
🟢 0.1192 — major SSL
Main takeaway: as long as 0.2176–0.2200 holds, an upside recovery remains structurally possible.
2. H4 — delivery logic
On H4 it’s clearly visible:
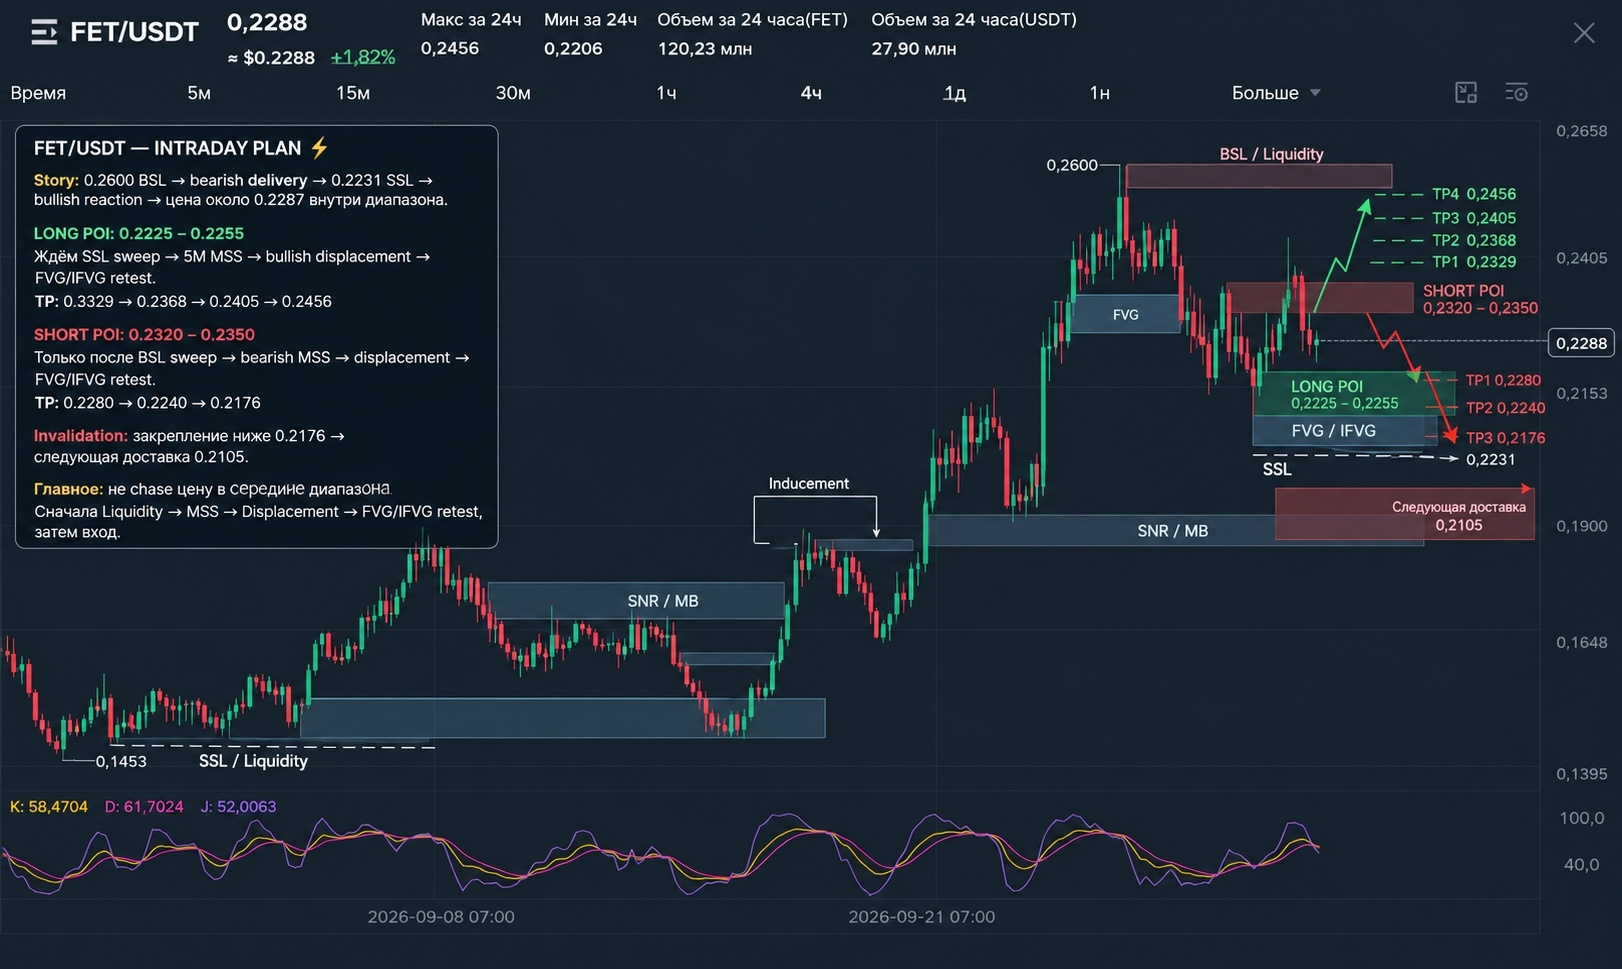
0.1453 → bullish displacement → 0.2600 → bearish correction → 0.215–0.217 → recovery.
After the 0.2600 high, sellers weren’t able to continue the move toward 0.1900/0.1800 and formed a reaction from the 0.215–0.217 area.
Right now the price is around 0.2288.
H4 Liquidity
BSL:
0.2329–0.2405
0.2456
0.2600
SSL:
0.2231
0.2176
0.2105
That is, the market is currently located between two liquidity pools.
3. H1 — working structure
H1 shows a local range:
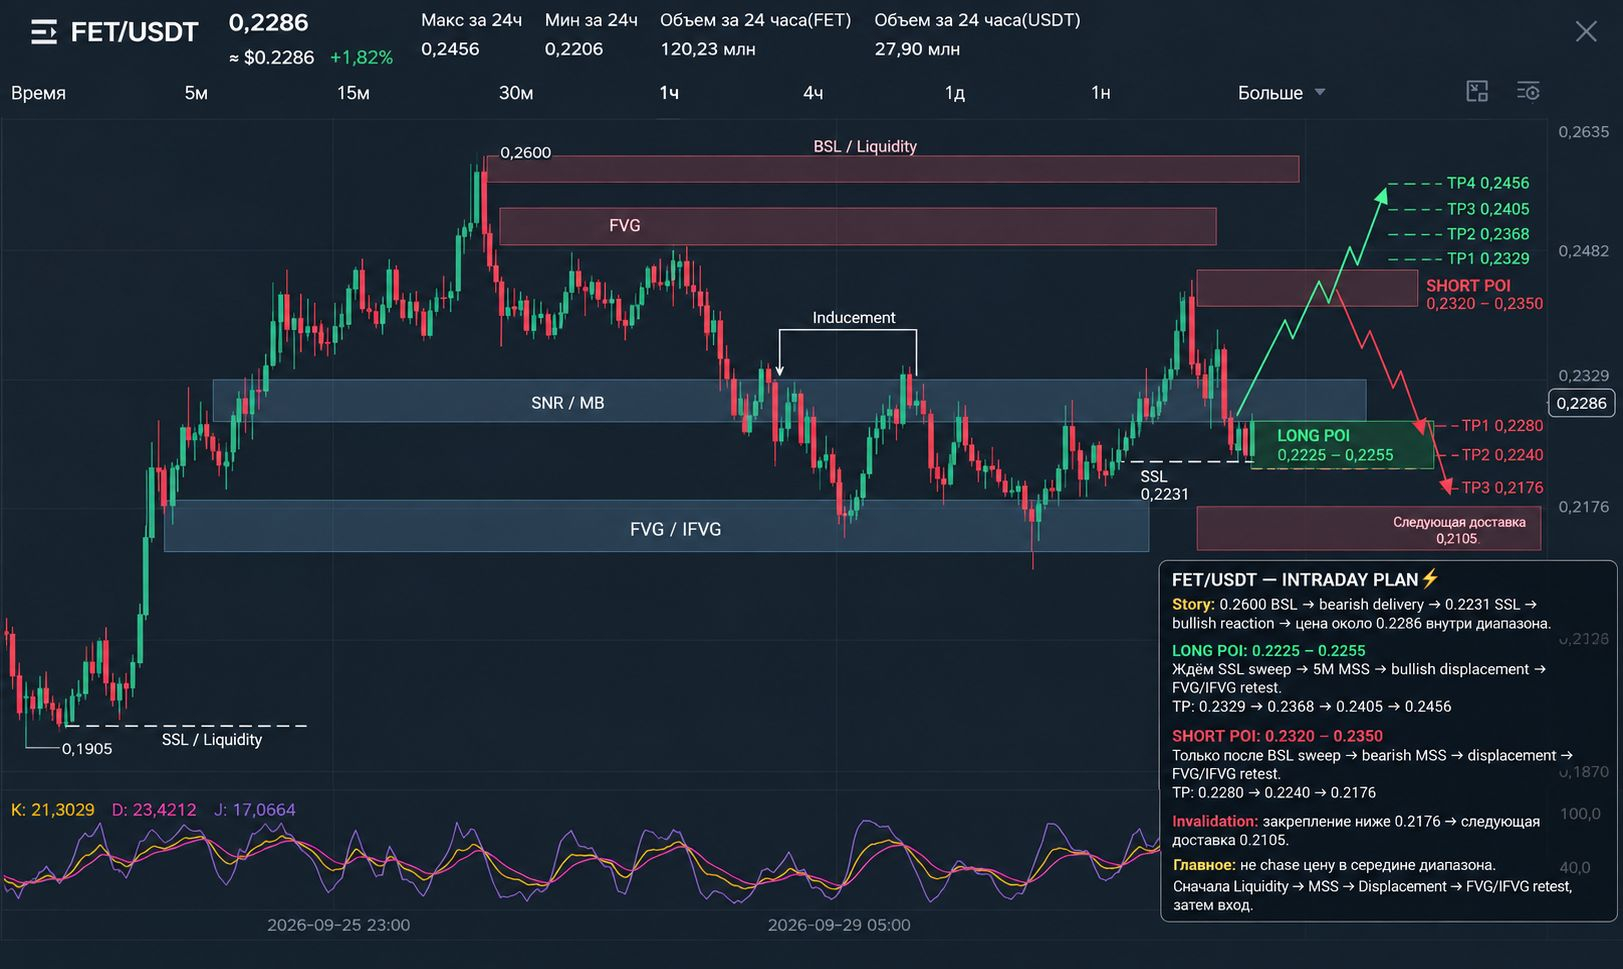
0.2176 → 0.2456
After the impulse to 0.2456, there was bearish delivery:
0.2456 → 0.2240
Then a small bullish reaction appeared.
Right now 0.2287 — basically the middle of the local structure.
So there is no good reason to chase a LONG here.
Important H1 levels
Resistance:
0.2329
0.2368
0.2395–0.2405
0.2456
Support:
0.2240–0.2231
0.2176
0.2105
4. M15 — next delivery
M15 is especially important for today’s scenario.
It was formed:
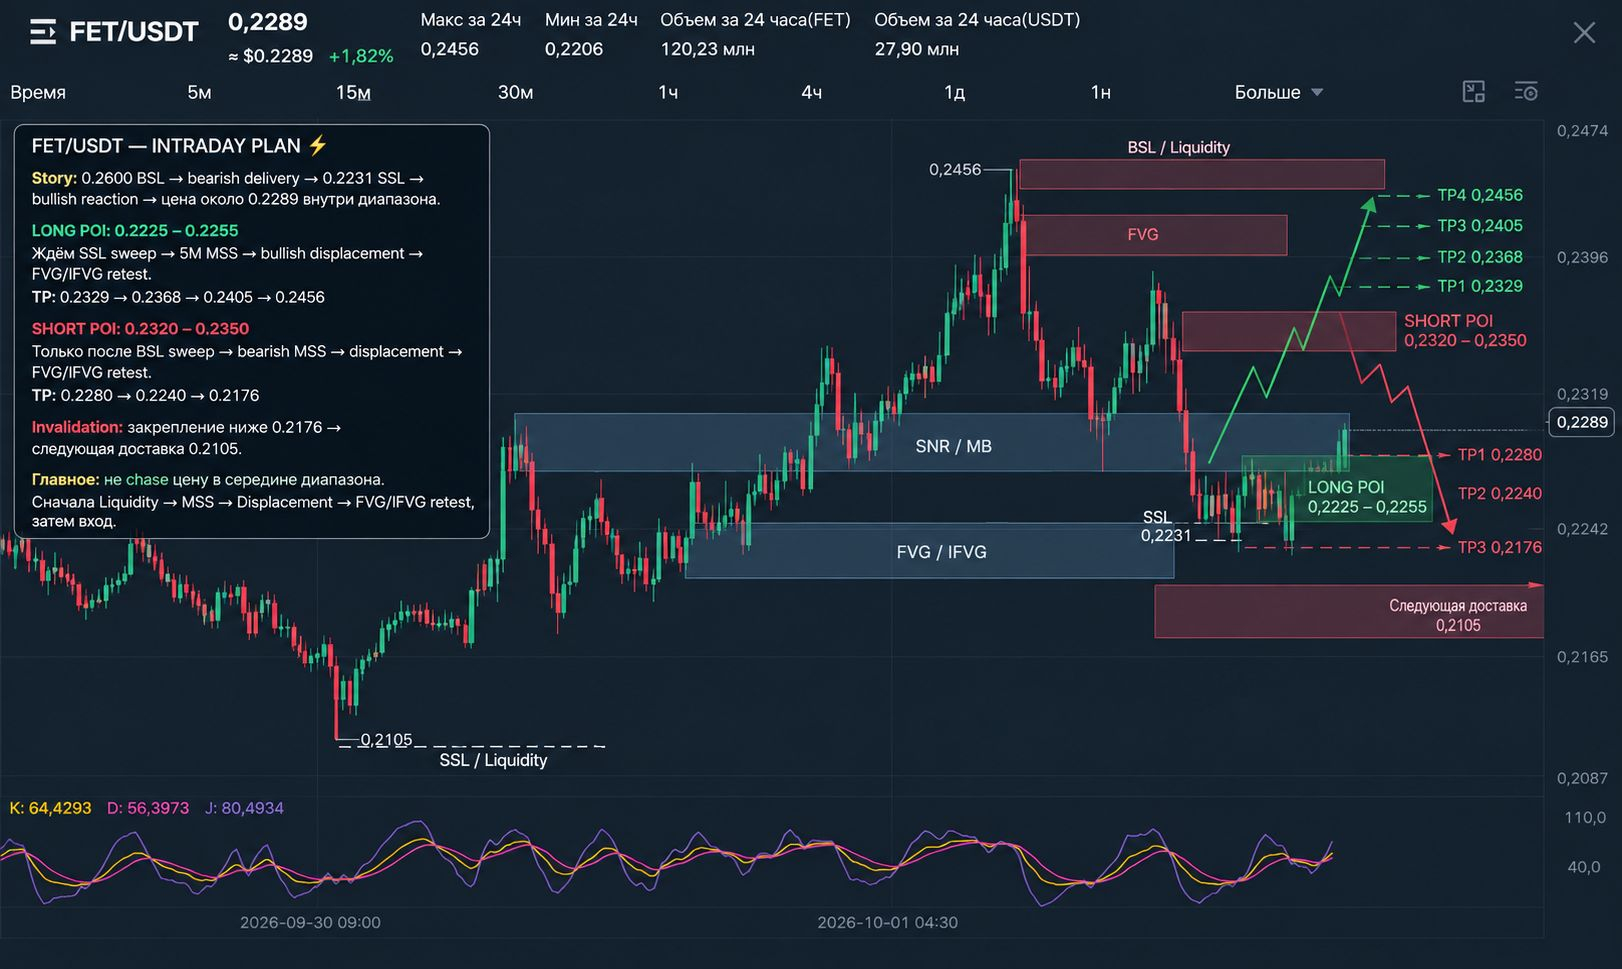
0.2456 → bearish displacement → 0.2231 → consolidation → bullish reaction.
Thus, 0.2231 is currently the nearest obvious SSL.
If the market first takes:
0.2231 SSL
and then we’ll get:
SSL sweep → bullish MSS → displacement → FVG/IFVG retest
this will be a full LONG setup according to our model.
5. M5 — entry point
On M5 the current structure is:
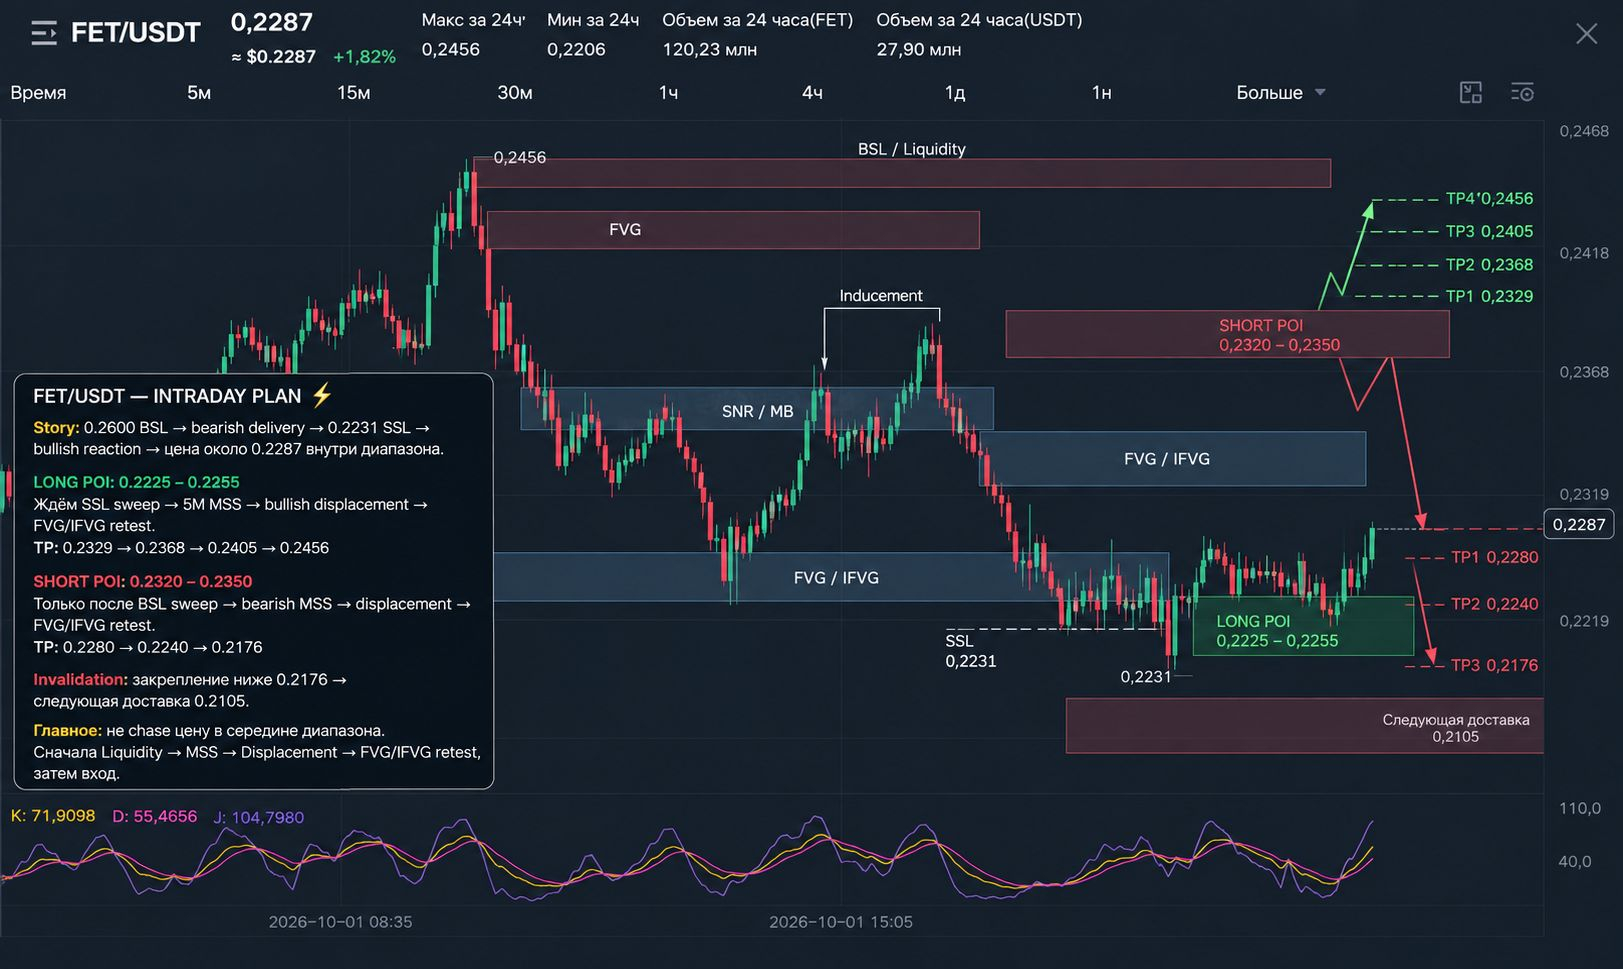
0.2231 low → accumulation → bullish displacement → 0.2287.
Price has already bounced a bit from the lower part of the range.
So we are not chasing LONG on the market right now.
We need either:
Scenario A — LONG
0.2231 SSL sweep
↓
5M bullish MSS
↓
bullish displacement
↓
FVG/IFVG retest
↓
LONG
Working interest zone:
🟢 LONG POI: 0.2225–0.2255
But the zone itself is not an automatic entry. We need a reaction after liquidity is swept.
🔴 SHORT scenario
For SHORT it’s more interesting to first see delivery of price upward.
SHORT POI 1:
0.2320–0.2350
This is where the nearest internal liquidity / resistance is.
Condition:
BSL sweep → bearish MSS → displacement → FVG/IFVG retest
SHORT POI 2:
0.2390–0.2420
If the market continues to deliver upward, this zone becomes the next potential POI.
Above it is 0.2456 BSL.
If it happens:
0.2456 sweep → bearish MSS
that will give a stronger SHORT setup.
🎯 FET/USDT — INTRADAY PLAN
Story:
0.2600 BSL → bearish delivery → 0.2231 SSL → bullish reaction → current price 0.2287 is inside the range.
🟢 LONG
0.2225–0.2255
Only:
SSL sweep → 5M MSS → bullish displacement → FVG/IFVG retest.
TP:
0.2329 → 0.2368 → 0.2405 → 0.2456
🔴 SHORT
0.2320–0.2350
Only after:
BSL sweep → bearish MSS → displacement → FVG/IFVG retest.
TP:
0.2280 → 0.2240 → 0.2176
🔴 A deeper SHORT POI
0.2390–0.2420
With confirmed rejection:
TP 0.2329 → 0.2240 → 0.2176
⚠️ Invalidation
Bullish scenario: sustained consolidation below 0.2176 worsens the LONG narrative. Then the next delivery zone is — 0.2105.
Bearish scenario: strong acceptance of price above 0.2456 opens the way to a retest of 0.2600.
Main logic
We do not trade the middle of the 0.2287 range. Wait for what liquidity the market takes first.
2231 SSL → LONG confirmation
or
2329–2456 BSL → SHORT confirmation.
Exactly the Narrative → Liquidity → MSS → Displacement → FVG/IFVG retest should determine the entry.$FET