$BTC Bitcoin Circle Academician: 10.2 BTC bull road—taking a rest is not a top? Looking at the outlook from a multi-period perspective? Latest market analysis and trading suggestions
Bitcoin’s current price is 83,800. During the National Day holiday, wishing all coin friends a happy holiday. The market doesn’t stop and prices keep moving, but you can control the trading rhythm yourself. The choppy range market at high levels is still in a tug-of-war—no need to constantly stare at the screen with tight nerves. Spend time with your family and get a good rest. The market is always there. May everyone hold onto their accounts, stay calm, have a peaceful and smooth holiday, and wait for the market to break out of the range—we’ll fight again after the holiday.
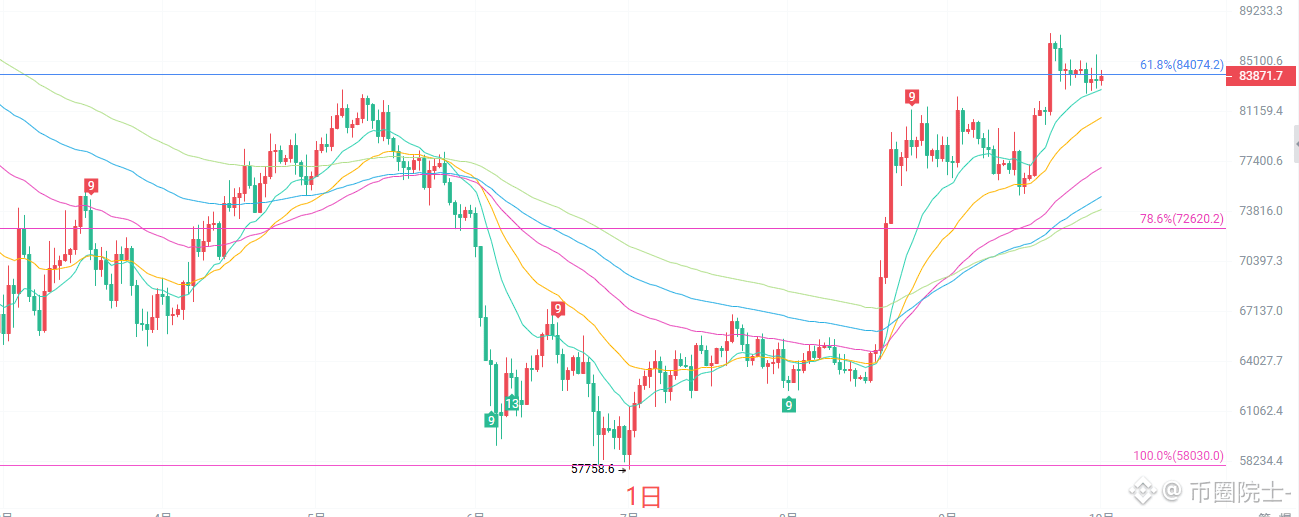
The daily K-line is exactly near this key level. The moving average system—EMA15 and EMA30—remains stacked upward, and the medium-to-long-term trend is still overall bullish. The MACD indicator’s red histogram continues to shrink; DIF and DEA have turned down from the high level, and bullish momentum has somewhat weakened. The Bollinger Bands are tightening: the upper band is 88,674 and the lower band is 74,595. Price is trading in the upper half of the Bollinger range. The daily chart structure belongs to consolidation in the high area after a big rally. There is strong resistance overhead at 87,385. The key support below is at 80,679. Only by holding above the previous high can it open up new upside space. If support breaks, it will trigger a deeper pullback.
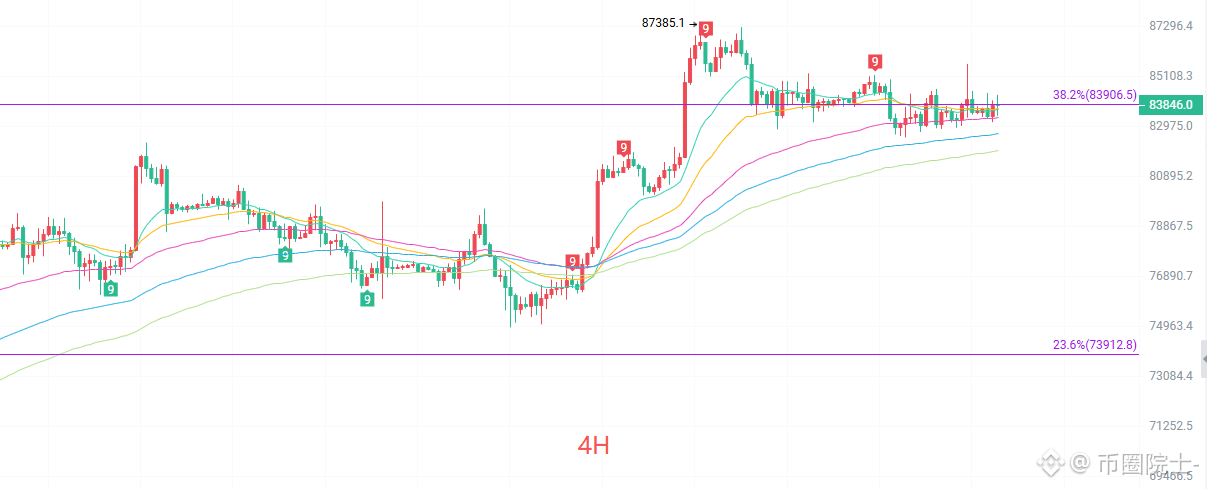
On the 4-hour chart, the short-term EMA lines are intertwined and sticking together, indicating a balance between short-term bulls and bears. The MACD indicator’s DIF crosses below DEA to form a dead cross; the green histogram has a slight expansion, meaning short-term bearish power has a weak edge. The Bollinger Bands continue to narrow: upper band 84,299 and lower band 82,844. Price is oscillating around the middle band. The 4-hour chart hasn’t formed a clear direction yet—it’s a typical range-trading/position-clearing move. There is no one-way trend in the short term, so it’s not suitable to chase or cut aggressively based on price swings.
Short-term reference
Go north: from 83,300 to 82,800 to stop the drop; stop-loss 500 points; targets 85,500 to 86,800
Go south: from 85,800 to 86,300 after gains stall; stop-loss 500 points; targets 85,000 to 84,000
For specific execution, rely mainly on real-time order-book data. More information can be found by contacting the author for details. Article publishing may be delayed; the advice is for reference only—risk is your own.
#BTC走势分析
Bitcoin’s current price is 83,800. During the National Day holiday, wishing all coin friends a happy holiday. The market doesn’t stop and prices keep moving, but you can control the trading rhythm yourself. The choppy range market at high levels is still in a tug-of-war—no need to constantly stare at the screen with tight nerves. Spend time with your family and get a good rest. The market is always there. May everyone hold onto their accounts, stay calm, have a peaceful and smooth holiday, and wait for the market to break out of the range—we’ll fight again after the holiday.
The daily K-line is exactly near this key level. The moving average system—EMA15 and EMA30—remains stacked upward, and the medium-to-long-term trend is still overall bullish. The MACD indicator’s red histogram continues to shrink; DIF and DEA have turned down from the high level, and bullish momentum has somewhat weakened. The Bollinger Bands are tightening: the upper band is 88,674 and the lower band is 74,595. Price is trading in the upper half of the Bollinger range. The daily chart structure belongs to consolidation in the high area after a big rally. There is strong resistance overhead at 87,385. The key support below is at 80,679. Only by holding above the previous high can it open up new upside space. If support breaks, it will trigger a deeper pullback.
On the 4-hour chart, the short-term EMA lines are intertwined and sticking together, indicating a balance between short-term bulls and bears. The MACD indicator’s DIF crosses below DEA to form a dead cross; the green histogram has a slight expansion, meaning short-term bearish power has a weak edge. The Bollinger Bands continue to narrow: upper band 84,299 and lower band 82,844. Price is oscillating around the middle band. The 4-hour chart hasn’t formed a clear direction yet—it’s a typical range-trading/position-clearing move. There is no one-way trend in the short term, so it’s not suitable to chase or cut aggressively based on price swings.
Short-term reference
Go north: from 83,300 to 82,800 to stop the drop; stop-loss 500 points; targets 85,500 to 86,800
Go south: from 85,800 to 86,300 after gains stall; stop-loss 500 points; targets 85,000 to 84,000
For specific execution, rely mainly on real-time order-book data. More information can be found by contacting the author for details. Article publishing may be delayed; the advice is for reference only—risk is your own.
#BTC走势分析