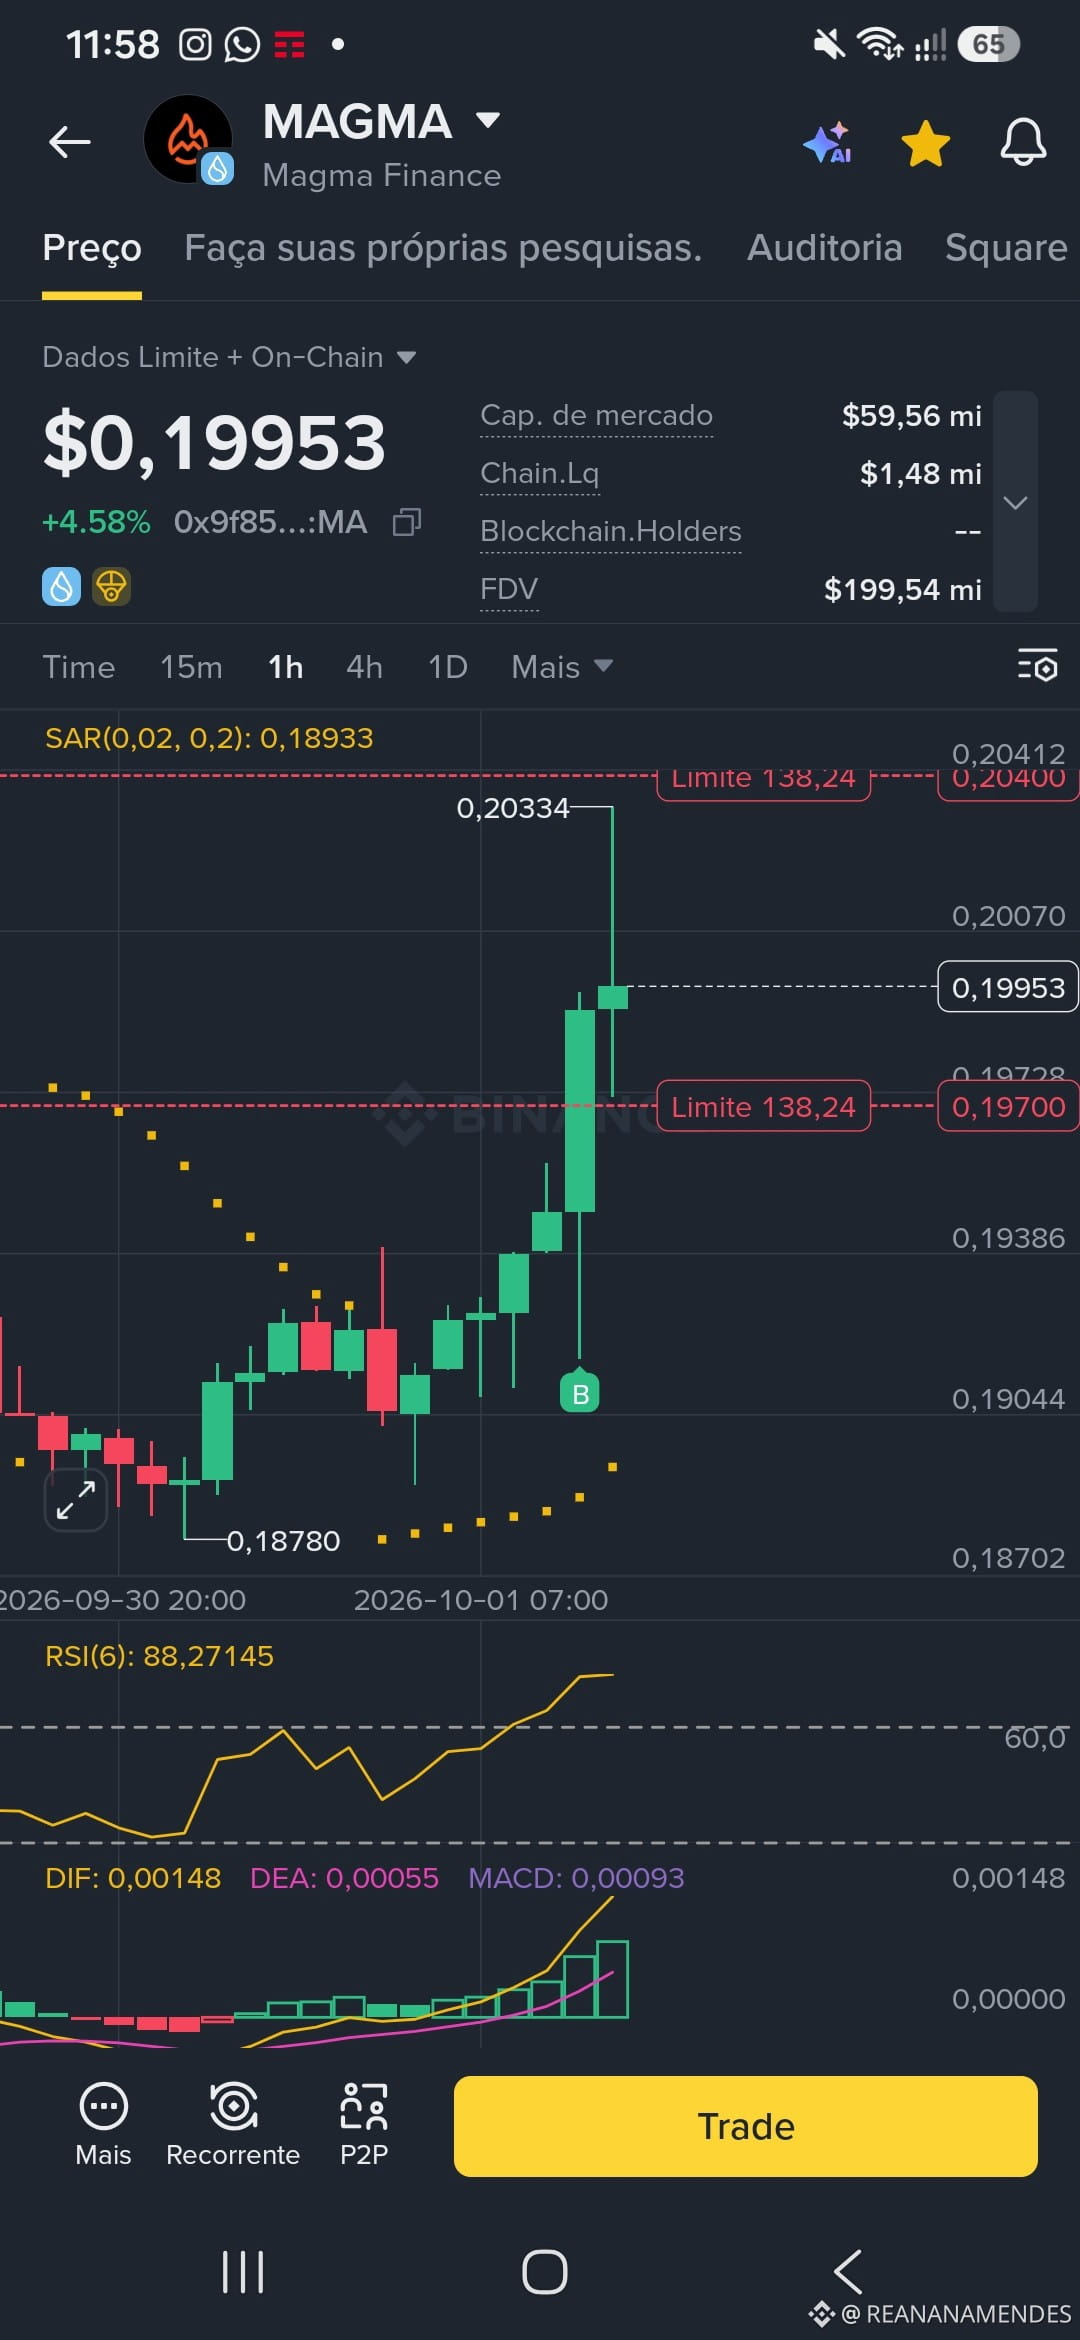
$MAGMA 🚀 $MAGMA / USDT (1h) – Breakout with High Volume! 📈
The $MAGMA token surged in the past hours, breaking out of the $0,187 region to test resistance at $0,203. Currently trading around $0,199.
🔍 Technical Highlights:
• Trend: Bullish reversal signaled by the Parabolic SAR (yellow dots crossed downward).
• Indicators: RSI(6) at 88.2 (overbought zone—watch for possible short-term corrections) and MACD crossed upward with expanding green bars.
• Key Levels:
🛑 Support: $0,197 (limit area) / $0,189.
🎯 Resistance: $0,203 - $0,204.
💡 Market View: The move shows strong buying power on the 1h chart. It’s worth watching whether there will be consolidation above $0,197 to seek new highs, or whether the overbought RSI will bring a retest before continuation.
What do you think about this move? Will you enter the buy or wait for the correction? 👇🔥
The $MAGMA token surged in the past hours, breaking out of the $0,187 region to test resistance at $0,203. Currently trading around $0,199.
🔍 Technical Highlights:
• Trend: Bullish reversal signaled by the Parabolic SAR (yellow dots crossed downward).
• Indicators: RSI(6) at 88.2 (overbought zone—watch for possible short-term corrections) and MACD crossed upward with expanding green bars.
• Key Levels:
🛑 Support: $0,197 (limit area) / $0,189.
🎯 Resistance: $0,203 - $0,204.
💡 Market View: The move shows strong buying power on the 1h chart. It’s worth watching whether there will be consolidation above $0,197 to seek new highs, or whether the overbought RSI will bring a retest before continuation.
What do you think about this move? Will you enter the buy or wait for the correction? 👇🔥