

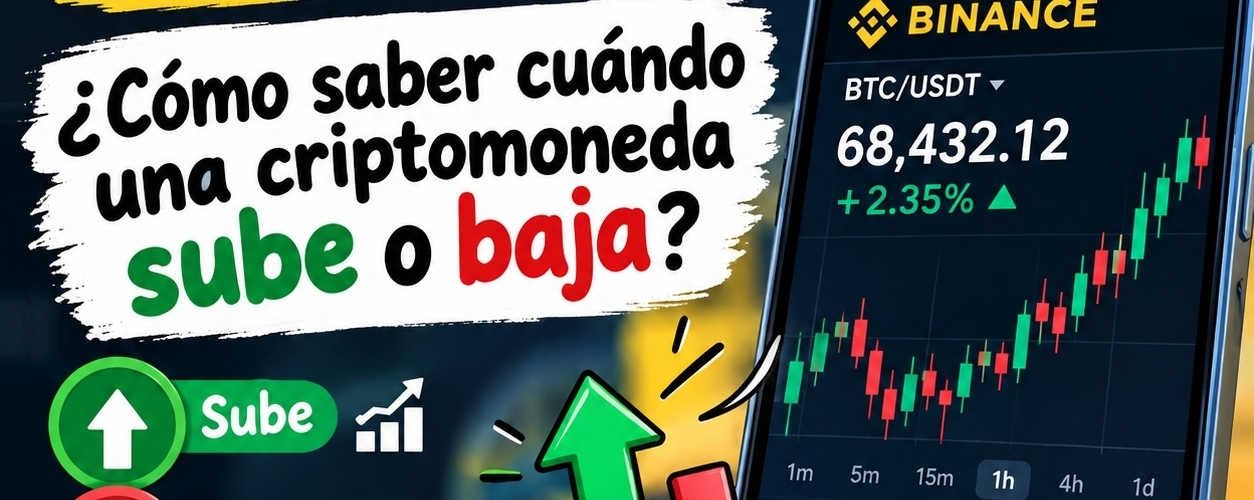

📊 How can you tell when a cryptocurrency is going up or down?
If you’ve already learned how to buy and sell cryptocurrencies, it’s now important to learn how to read the price before making a transaction.
🟢 When the price goes up
On Binance, you can see that the price of a cryptocurrency increases. For example:
BTC:
- Buy: $100
- Current price: $103
- Change: +3%
In this case, the price has gone up.
🔴 When the price goes down
If you bought a cryptocurrency for $100 and its price drops to $97, you would be seeing a decrease in price:
Variation: -3%
This doesn’t automatically mean you’ve permanently lost the money. The loss becomes real when you sell below your purchase price.
📈 Learn how to read the chart
On Binance you’ll find a chart with candles. Each candle represents the price movement during a specific period.
🟢 A green candle generally indicates that the price closed higher than where it began that period.
🔴 A red candle generally indicates it closed lower.
You can also change the chart timeframe to observe minute, hour, or day movements.
💡 Tip for beginners
Don’t buy a cryptocurrency just because you see it going up.
Before trading, review:
✅ Current price
✅ Percentage variation
✅ Chart
✅ Trading fee
✅ Amount you’re going to use
✅ Price you’d be willing to sell at
And remember: cryptocurrencies can rise and fall quickly.
🎯 In the next part
We’ll learn what “buy price,” “sell price,” and “profit or loss” mean—fundamental concepts to start trading with greater clarity.
📚 Series: Binance for beginners
Part 15 — Learn how to identify when the price goes up or down.