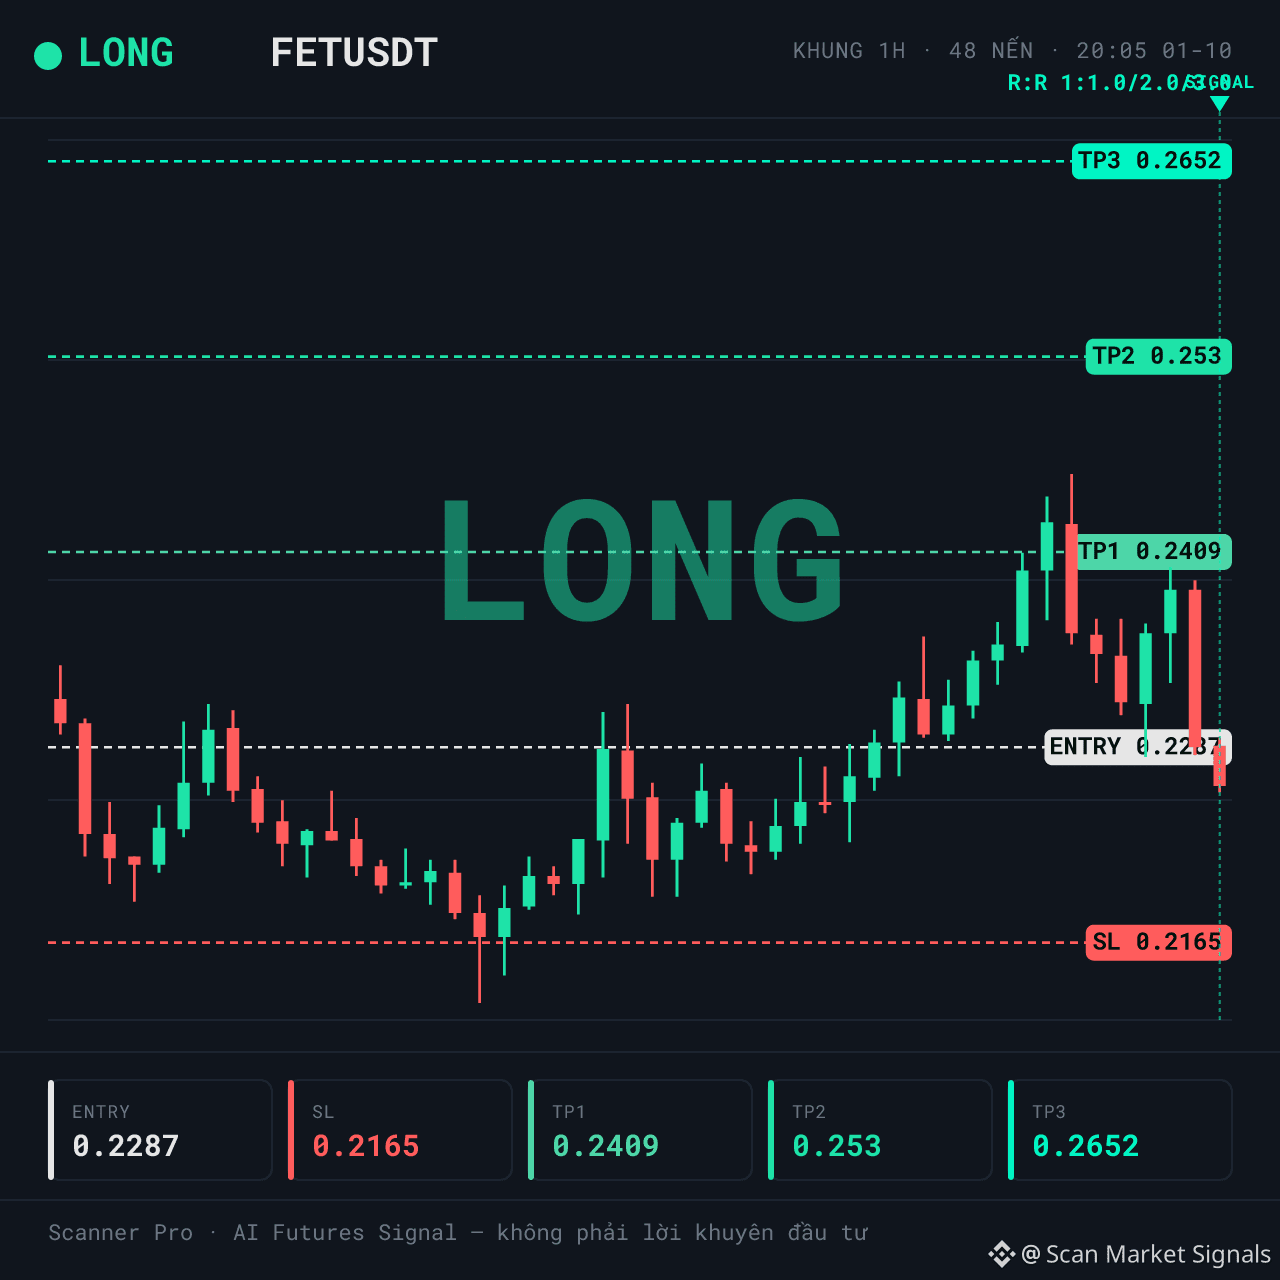
LONG $FET | Volume spike 0.32x — the cash flow hasn’t truly kicked in yet
🚨 AI TRADE ALERT — $FET
🟢 LONG
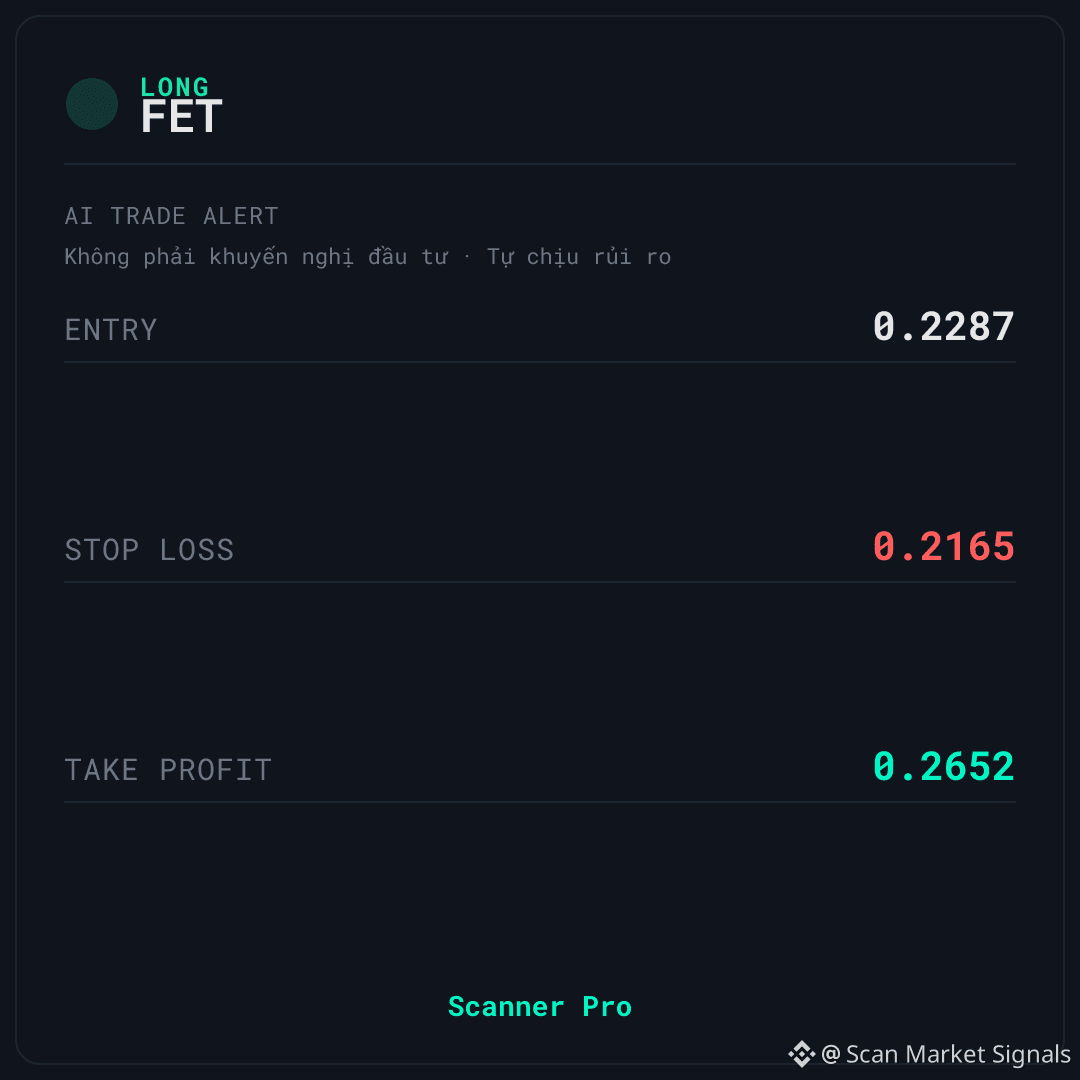
📌 Entry: 0.2284 – 0.229
🛑 Stop Loss: 0.2165
🎯 Take Profit: 0.2652
⏰ Valid for: 6 hours (20:05 on 01/10 – 02:05 on 02/10, VN time)
↔️ SIDEWAY — the market is moving sideways; the signal is fading (mean reversion)
$FET is being tracked by Scanner Pro under the LONG scenario when price pulls back toward the lower end of the 24h range and momentum hasn’t been pushed too high. The context is classified as sideways, with a classification confidence of 55, and 24h volume of about 81,233,496 (in quote asset) with a volume spike of 0.32x.
📊 CONTEXT & DATA
The story here is a pullback within a sideways range: price is currently at 26% of the 24h range, i.e., the lower side of the trading band, and the 1h momentum at 44,75 hasn’t yet shown that the buying side has been drained. Funding at 0.0100% means the LONG side is paying fees to the SHORT side.
The 24h volume is about 81,233,496 (in quote asset), but the volume spike is only 0.32x — the money flow hasn’t really entered yet, so this is a point to monitor further before considering the structure to be sustainable.
🚫 INVALIDATION POINT & RISK MANAGEMENT — $FET
⚠️ The biggest downside: the crowd is leaning in the same direction as this signal, and that side is paying fees. The market is skewed long, which is a risk to monitor, not a support factor. The sideways context with classification confidence 55 also isn’t strong enough to confirm a trend.
🚫 If price closes below the stop-loss level on the signal card, the current LONG scenario is no longer valid.
💡 Do you think this is a pullback for accumulation, or a sign that the buying side is gradually losing its advantage?
This is educational technical analysis content, not investment advice. Crypto trading carries high risk, and you could lose all of your capital. Do your own research and take responsibility for your decisions.
#Binance #Crypto #Futures
🚨 AI TRADE ALERT — $FET
🟢 LONG
📌 Entry: 0.2284 – 0.229
🛑 Stop Loss: 0.2165
🎯 Take Profit: 0.2652
⏰ Valid for: 6 hours (20:05 on 01/10 – 02:05 on 02/10, VN time)
↔️ SIDEWAY — the market is moving sideways; the signal is fading (mean reversion)
$FET is being tracked by Scanner Pro under the LONG scenario when price pulls back toward the lower end of the 24h range and momentum hasn’t been pushed too high. The context is classified as sideways, with a classification confidence of 55, and 24h volume of about 81,233,496 (in quote asset) with a volume spike of 0.32x.
📊 CONTEXT & DATA
The story here is a pullback within a sideways range: price is currently at 26% of the 24h range, i.e., the lower side of the trading band, and the 1h momentum at 44,75 hasn’t yet shown that the buying side has been drained. Funding at 0.0100% means the LONG side is paying fees to the SHORT side.
The 24h volume is about 81,233,496 (in quote asset), but the volume spike is only 0.32x — the money flow hasn’t really entered yet, so this is a point to monitor further before considering the structure to be sustainable.
🚫 INVALIDATION POINT & RISK MANAGEMENT — $FET
⚠️ The biggest downside: the crowd is leaning in the same direction as this signal, and that side is paying fees. The market is skewed long, which is a risk to monitor, not a support factor. The sideways context with classification confidence 55 also isn’t strong enough to confirm a trend.
🚫 If price closes below the stop-loss level on the signal card, the current LONG scenario is no longer valid.
💡 Do you think this is a pullback for accumulation, or a sign that the buying side is gradually losing its advantage?
This is educational technical analysis content, not investment advice. Crypto trading carries high risk, and you could lose all of your capital. Do your own research and take responsibility for your decisions.
#Binance #Crypto #Futures