#شارك_أفكارك_حول_BTC $BTC
The larger picture is relatively positive: in the near term, there is a dense sell ceiling that is hindering the upward move.
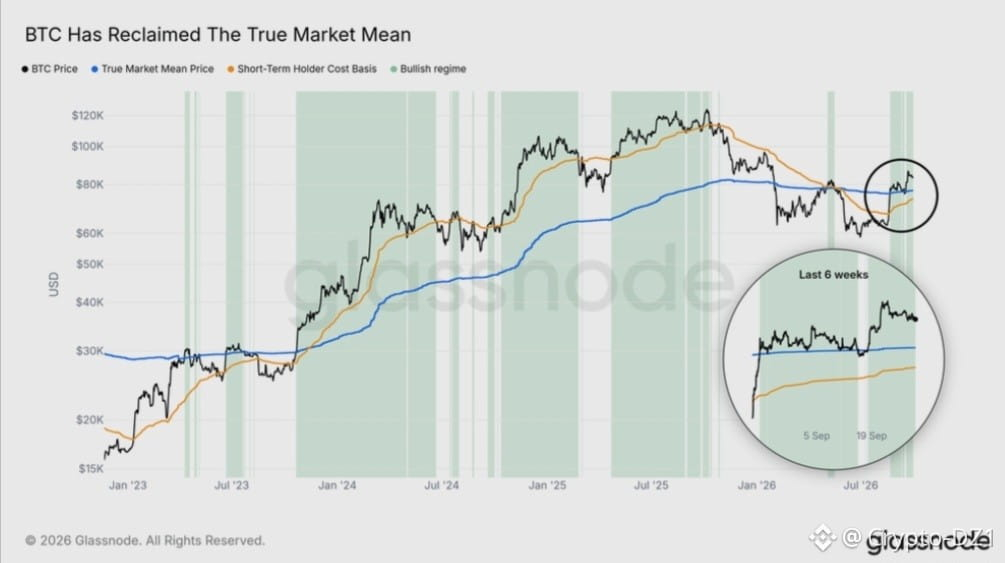
Figure 1 – Recovery of the Real Market Mean (True Market Mean):
- Bitcoin regained the blue line (around $77–78k) and has held above it during the last six weeks; this level is considered a dividing line between the up and down cycles.
- The price is also above the cost basis of short-term holders (orange, about $73–74k), and new green areas have appeared, indicating the return of the uptrend.
- Historically, holding above this mean supports continued upside, while breaking below it implies a return to bearish pressure (as happened in early 2026).
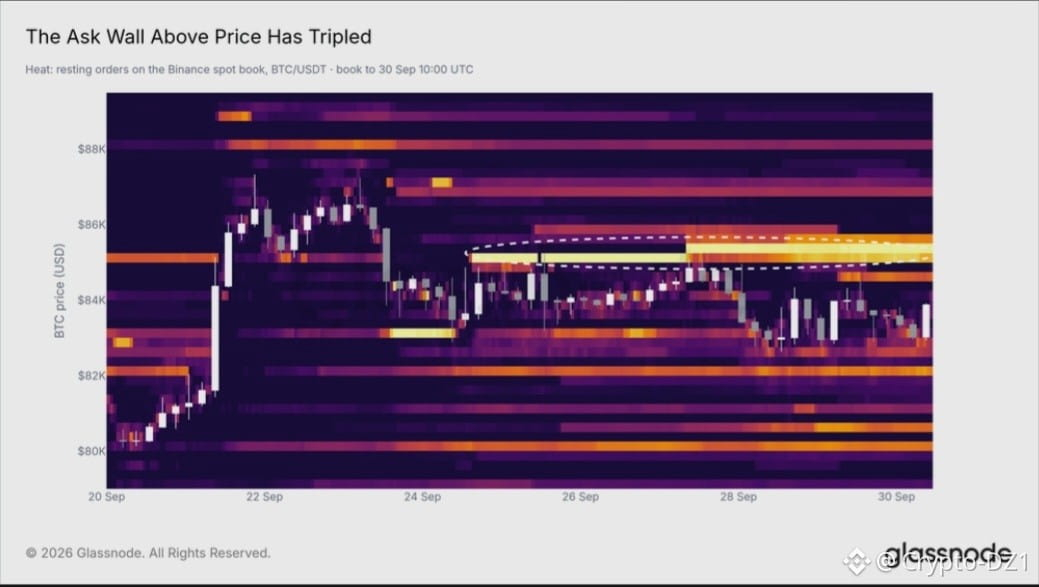
Figure 2 – Sell wall (Binance):
- Pending sell orders above the price have tripled; the heaviest concentration is around $85k and above up to about $86k.
- The price is moving in a tight range between $82.5k and $84.5k and has failed more than once to break the $85k area.
- Near support is visible at $83k, then at $82k (buy-order lines).
Combined read:
- **Bullish scenario:** a breakout and a firm close above $85–86k means the wall is absorbed, and it often paves the way toward $88k and higher.
- **Bearish/choppy scenario:** continued rejection at $85k could push the price back to test $82–83k; the most important larger support is the $77–78k region (the real mean).
- The wall could be real or spoof orders that get pulled as price approaches, so it should not be relied on by itself.
The larger picture is relatively positive: in the near term, there is a dense sell ceiling that is hindering the upward move.
Figure 1 – Recovery of the Real Market Mean (True Market Mean):
- Bitcoin regained the blue line (around $77–78k) and has held above it during the last six weeks; this level is considered a dividing line between the up and down cycles.
- The price is also above the cost basis of short-term holders (orange, about $73–74k), and new green areas have appeared, indicating the return of the uptrend.
- Historically, holding above this mean supports continued upside, while breaking below it implies a return to bearish pressure (as happened in early 2026).
Figure 2 – Sell wall (Binance):
- Pending sell orders above the price have tripled; the heaviest concentration is around $85k and above up to about $86k.
- The price is moving in a tight range between $82.5k and $84.5k and has failed more than once to break the $85k area.
- Near support is visible at $83k, then at $82k (buy-order lines).
Combined read:
- **Bullish scenario:** a breakout and a firm close above $85–86k means the wall is absorbed, and it often paves the way toward $88k and higher.
- **Bearish/choppy scenario:** continued rejection at $85k could push the price back to test $82–83k; the most important larger support is the $77–78k region (the real mean).
- The wall could be real or spoof orders that get pulled as price approaches, so it should not be relied on by itself.