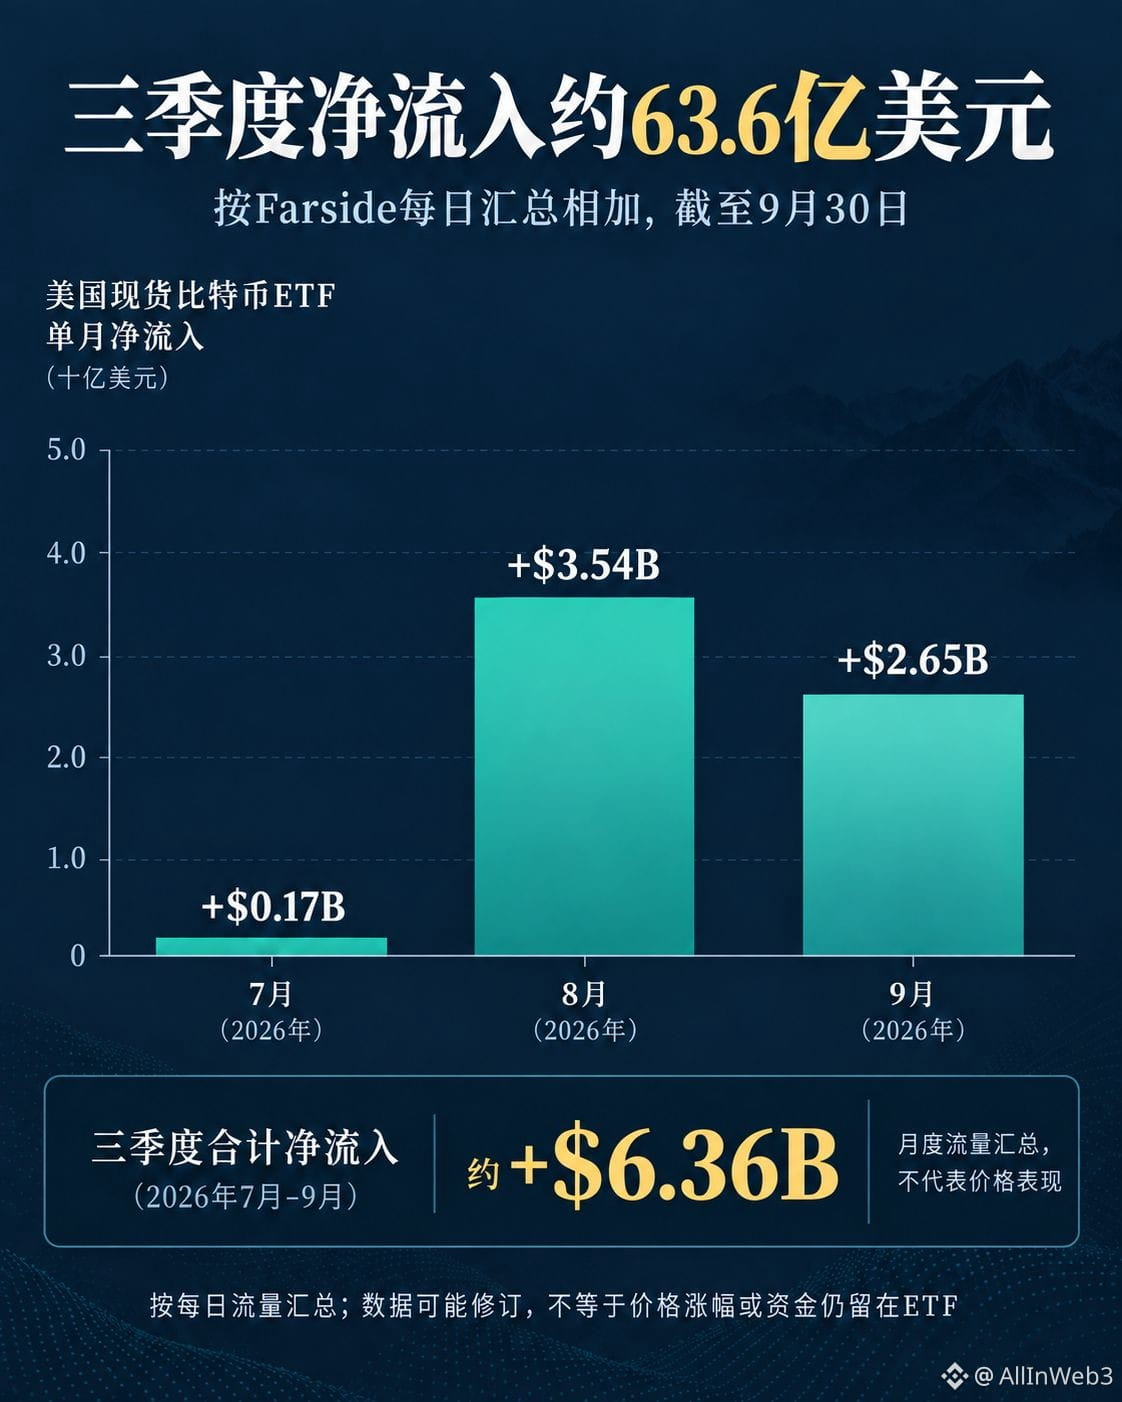
#Bitcoin ETF saw net inflows of $6.34 billion in Q3: the Binance Square current trending list states $6.34 billion, and the direction is consistent with Farside’s daily figures. Summing the Daily Total net flow from July through September yields about $6.36 billion: roughly $170 million in July, about $3.54 billion in August, and about $2.65 billion in September. The monthly values have been rounded, so recalculating the total differs from the trending list by about $20 million. Also, the day-by-day data may be revised later; this article treats the figures as approximate cumulative totals.
The timeline shows that net inflows were not uniform: August contributed the most, and September was still positive but lower than August. This supports the description that the spot ETF channel in Q3 saw net subscriptions overall, and it also indicates that attributing the entire quarter to a one-day “capital shock” is not accurate. Market interpretation should focus on the distribution and persistence of flows—not just the quarterly total.
ETF net inflows are a reporting metric based on fund share subscriptions/redemptions; they do not mean that all the current money is still held in the fund, nor do they directly equate to the magnitude of BTC price gains. They also cannot, by themselves, prove that buy-side demand pushed prices higher. Flows can move in the same direction as price, futures positioning, and USD liquidity—or they can diverge. Correlation needs to be assessed only after aligning the specific dates.
This round of additional verification cross-checks the trending list title against the primary daily table. The cumulative order of magnitude is close; however, adding day-by-day totals comes to about $6.36 billion. Therefore, when retaining the trending list’s $6.34 billion wording, it’s necessary to state the difference in reporting conventions to avoid pseudo-precision. Going forward, we can observe whether October’s daily net flows remain continuously positive, and whether inflows are concentrated in only a few trading days. If the net flow turns negative consecutively, the quarterly total should not be extrapolated as reflecting current demand.
Data: Farside Investors’ daily U.S. spot Bitcoin ETF flow table, statistics through September 30, 2026. If you sum the Daily Total values in the table, it may be subject to revision.
What can be confirmed right now is the quarterly statistics result. It does not mean that the direction of October flows is already determined. To judge whether demand continues, we still need to wait for subsequent daily data to be released and verify it day by day.
The monthly bar chart is only used to compare the net flow magnitudes across the three months; it is not plotted against the BTC price, and inflows are not converted into a number of units bought. The Farside data can be reconciled to single days, but fund subscription/redemption statistics and on-chain spot trade volumes are not the same reporting basis.
The timeline shows that net inflows were not uniform: August contributed the most, and September was still positive but lower than August. This supports the description that the spot ETF channel in Q3 saw net subscriptions overall, and it also indicates that attributing the entire quarter to a one-day “capital shock” is not accurate. Market interpretation should focus on the distribution and persistence of flows—not just the quarterly total.
ETF net inflows are a reporting metric based on fund share subscriptions/redemptions; they do not mean that all the current money is still held in the fund, nor do they directly equate to the magnitude of BTC price gains. They also cannot, by themselves, prove that buy-side demand pushed prices higher. Flows can move in the same direction as price, futures positioning, and USD liquidity—or they can diverge. Correlation needs to be assessed only after aligning the specific dates.
This round of additional verification cross-checks the trending list title against the primary daily table. The cumulative order of magnitude is close; however, adding day-by-day totals comes to about $6.36 billion. Therefore, when retaining the trending list’s $6.34 billion wording, it’s necessary to state the difference in reporting conventions to avoid pseudo-precision. Going forward, we can observe whether October’s daily net flows remain continuously positive, and whether inflows are concentrated in only a few trading days. If the net flow turns negative consecutively, the quarterly total should not be extrapolated as reflecting current demand.
Data: Farside Investors’ daily U.S. spot Bitcoin ETF flow table, statistics through September 30, 2026. If you sum the Daily Total values in the table, it may be subject to revision.
What can be confirmed right now is the quarterly statistics result. It does not mean that the direction of October flows is already determined. To judge whether demand continues, we still need to wait for subsequent daily data to be released and verify it day by day.
The monthly bar chart is only used to compare the net flow magnitudes across the three months; it is not plotted against the BTC price, and inflows are not converted into a number of units bought. The Farside data can be reconciled to single days, but fund subscription/redemption statistics and on-chain spot trade volumes are not the same reporting basis.