Asset Analysis ENA/USDT (4h/1d/1s/1m)
ENA/USDT is trading around 0.2573 USDT, after a strong rebound from the all-time low of 0.0699.
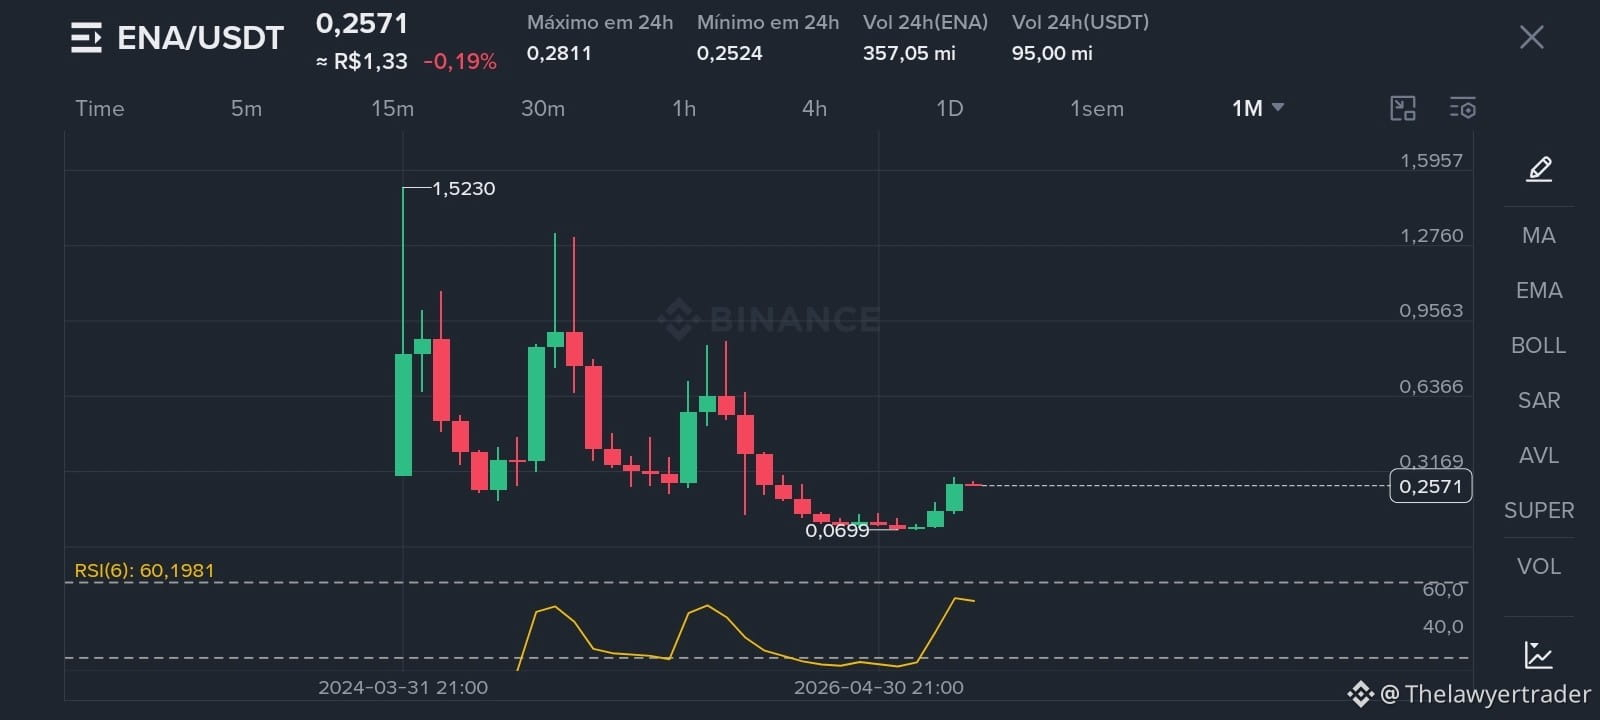
On the monthly chart, the asset still carries a long-term downtrend from the peak at 1.5230, but the most recent candles show a clear attempt at reversal, with the RSI(6) at 60—signaling moderate buying momentum without extreme overbought conditions.
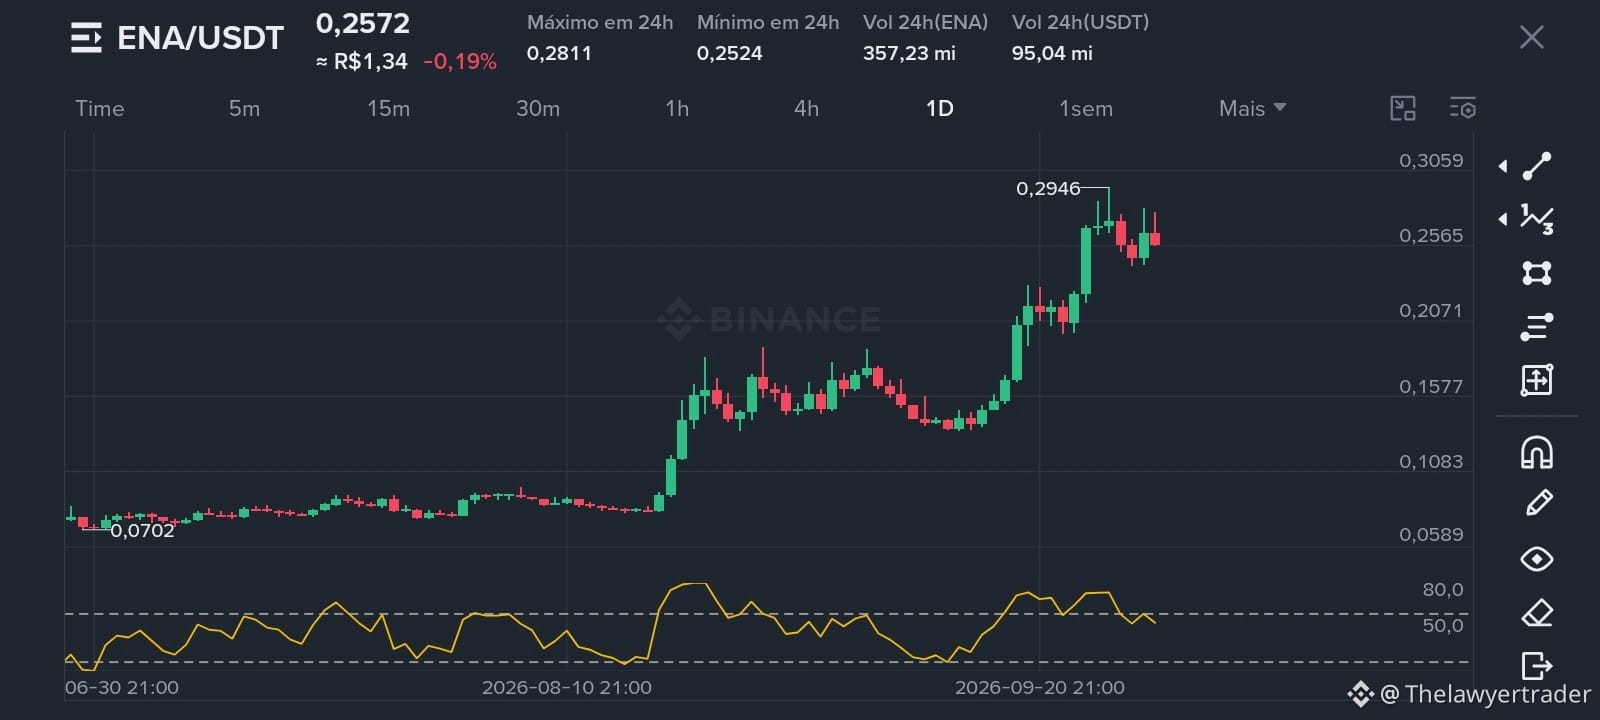
On the daily chart, the picture is more constructive: the price broke out of a sideways consolidation between 0.0702 and 0.1100 and formed a sequence of higher highs up to the local high of 0.2946. The RSI near 50 indicates balance, with no extremes.
This move forms a trend-reversal pattern (V-bottom) with a high likelihood of continuation, as long as the price holds support at 0.1500–0.1600.
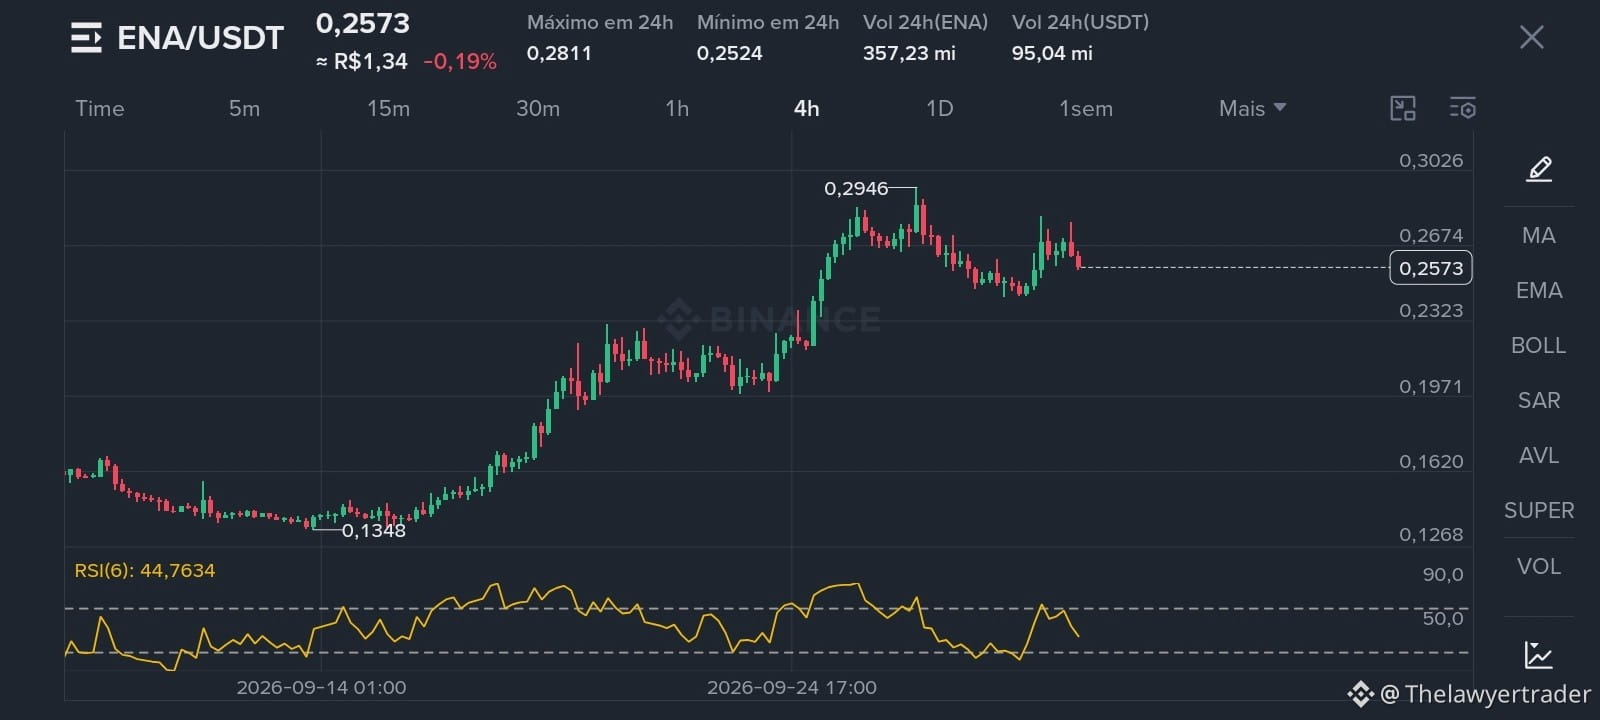
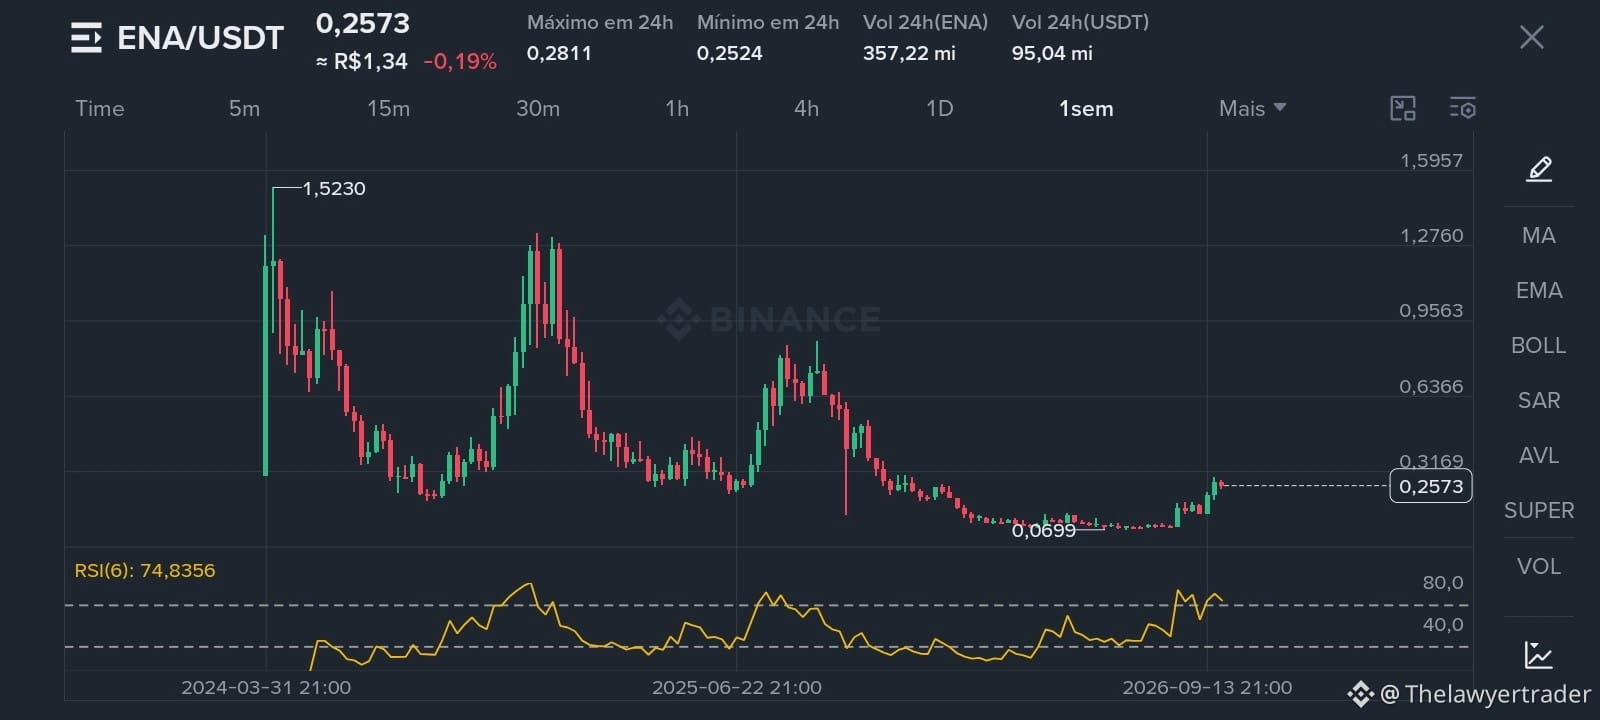
The warning comes from the short term. On the weekly chart, RSI(6) is at 74.8—an overbought area—and on the 4-hour chart the price is already correcting from the 0.2946 high, with RSI at 44.7 (neutral). In other words, the asset rose too fast and may go through consolidation or a correction before resuming the move.
Technical summary: bullish trend in the medium term, with a reversal pattern of moderate to high probability; in the short term, risk of pullback after the weekly overbought signal. Reference levels: resistance at 0.2946, and supports at 0.1500–0.1600 and 0.1348.
This analysis is based only on chart reading and does not constitute investment advice.
#ENA #ENAAnalysis $ENA
ENA/USDT is trading around 0.2573 USDT, after a strong rebound from the all-time low of 0.0699.
On the monthly chart, the asset still carries a long-term downtrend from the peak at 1.5230, but the most recent candles show a clear attempt at reversal, with the RSI(6) at 60—signaling moderate buying momentum without extreme overbought conditions.
On the daily chart, the picture is more constructive: the price broke out of a sideways consolidation between 0.0702 and 0.1100 and formed a sequence of higher highs up to the local high of 0.2946. The RSI near 50 indicates balance, with no extremes.
This move forms a trend-reversal pattern (V-bottom) with a high likelihood of continuation, as long as the price holds support at 0.1500–0.1600.
The warning comes from the short term. On the weekly chart, RSI(6) is at 74.8—an overbought area—and on the 4-hour chart the price is already correcting from the 0.2946 high, with RSI at 44.7 (neutral). In other words, the asset rose too fast and may go through consolidation or a correction before resuming the move.
Technical summary: bullish trend in the medium term, with a reversal pattern of moderate to high probability; in the short term, risk of pullback after the weekly overbought signal. Reference levels: resistance at 0.2946, and supports at 0.1500–0.1600 and 0.1348.
This analysis is based only on chart reading and does not constitute investment advice.
#ENA #ENAAnalysis $ENA