

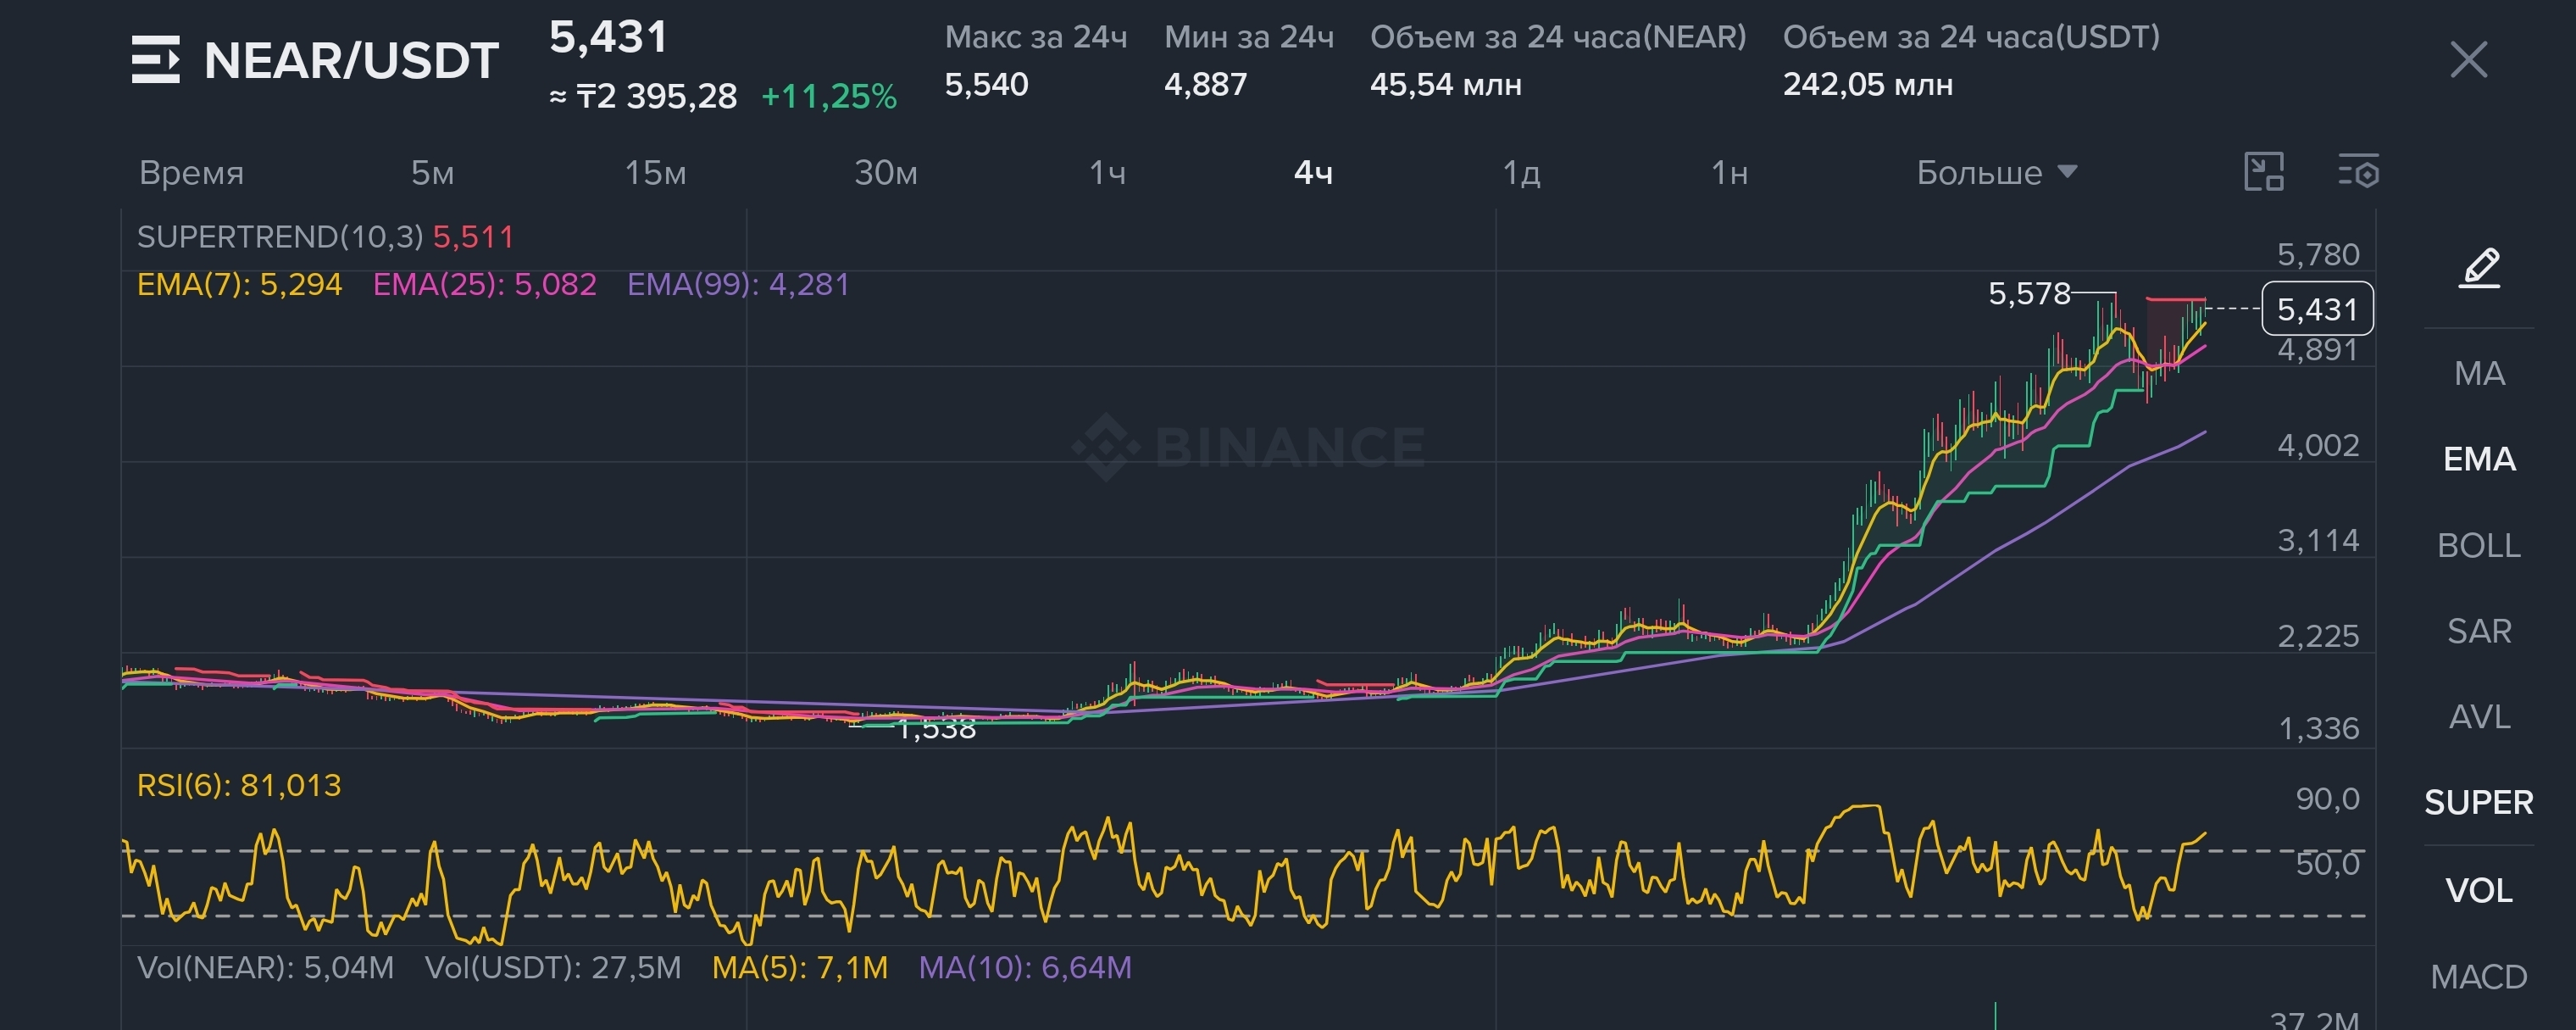

$NEAR 📊 NEAR/USDT — analysis of 4H
Based on the chart itself, the structure is still bullish, but the price has already surged significantly.
Price: 5.43
EMA 7: 5.29
EMA 25: 5.08
EMA 99: 4.28
Supertrend: 5.51
RSI(6): 81 — strong overbought
Local maximum: 5.58
The volume remains elevated.
Right now the price is practically hitting the 5.50–5.58 range. At the same time, an RSI above 80 increases the probability of a pause or pullback after such a surge. In the past few days, NEAR really showed sharp upward moves followed by pullbacks—meaning volatility is high.
🔥 Which scenario looks most logical on the chart
First consolidation/a slight pullback → then an attempt to break 5.58.
Key levels:
🟢 5.58 — the main resistance
🟡 5.30–5.20 — first support zone
🟡 5.05–5.10 — stronger support, EMA25
🔴 below 5.05 — the structure of the short-term uptrend clearly weakens
If 5.58 breaks through on strong volume and the price holds above, then the upward move may continue.
If there is again rejection from 5.50–5.58, a pullback to 5.30–5.20 to gather strength becomes more likely.
Conclusion: on the 4H timeframe the trend remains bullish, but right now buying momentum is riskier due to RSI 81 and resistance at 5.58. I would primarily watch how the price reacts to 5.58.
Not financial advice. This is a technical breakdown of the chart, not a guarantee of price movement.