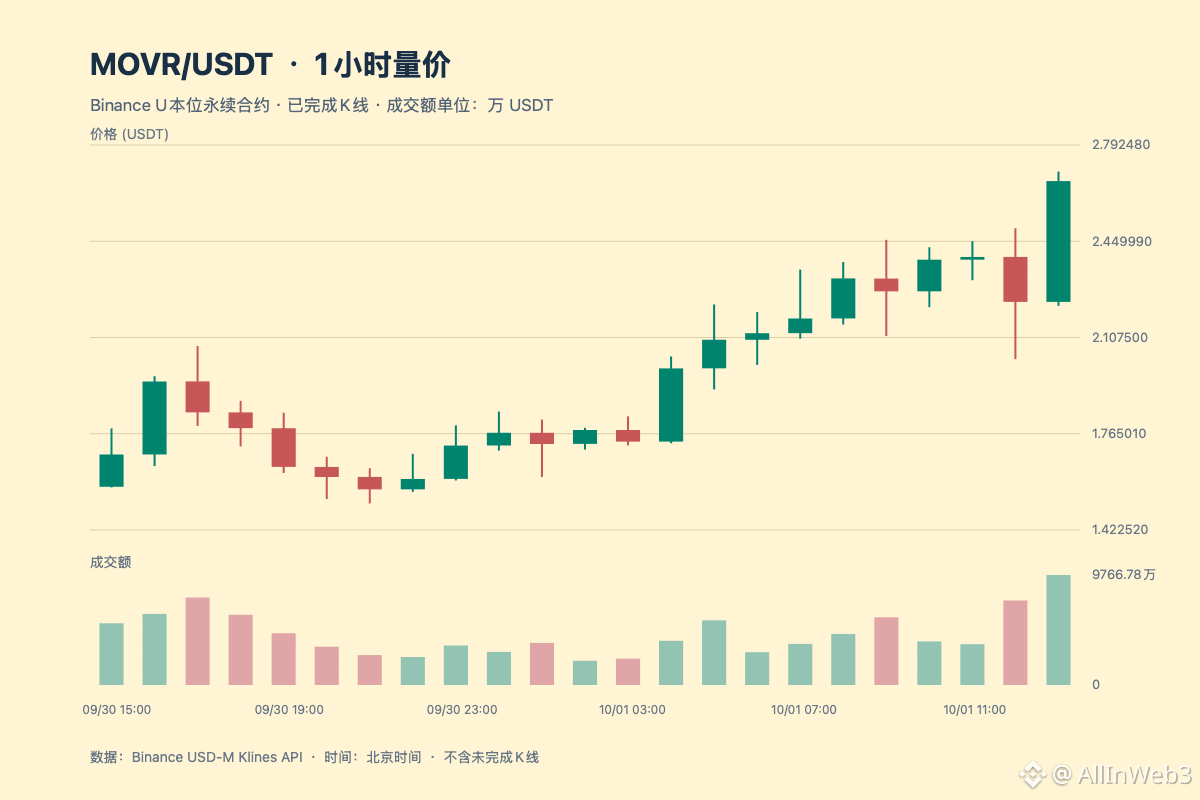
#MOVR In response to $MOVR , I’m still observing and not chasing the spike. On Binance, for the U-margined USDT perpetuals at 14:01 (Beijing time) on October 1, on the complete leaderboard for the period, MOVRUSDT is still ranked #1 in percentage gain: among 525 contract market conditions within the applicable range, all are valid. MOVRUSDT’s rolling 24-hour gain is 87.085%, with a quoted price of about 2.6798 USDT, and trading volume of about 1.0808 billion USDT. Before the full rescan prior to the 14:04 release, it remained at the top; the rolling gain has already changed to 89.879%, with the intraday quote around 2.7485. The incomplete 14:00 hour will still change. The numbers on the leaderboard are not a forecast of future gains. Compared with the post from this account at 12:05, 372475245625064, the most worth updating is the complete path: first a sharp drop at 12:00, then a volume expansion at 13:00 followed by a full reclaim of the old upper boundary.
The first paragraph is a breakdown. The previous post said that during the 11:00 hour it closed at 2.3941, and the 09:00 high at 2.4550 had not yet been confirmed by a complete closing. After that, from 12:00 to 13:00, the price first touched 2.4960, then dipped to 2.0303, and ultimately closed at 2.2343, which is about 6.7% lower than the 11:00 close. During this hour, the USDT trading amount was about 75.07 million, higher than the 11:00 hour by about 36.16 million. After piercing the old high during the session, it closed lower, indicating that high-level turnover and profit taking/backoff occurred at the same time. Increased volume alone cannot be used to infer net capital inflow, nor can it determine the exact liquidation size from the candlesticks.
The second paragraph is the reversal at 13:00. From 13:00 to 14:00, the full hour opened at 2.2343, with a low of 2.2201 and a high of 2.6980, and it finally closed at 2.6639—reclaiming above the old upper boundary at 2.4550 from the previous post that still needed validation, and it is about 8.5% higher than that level. Trading volume for this hour was about 97.67 million, about 30% higher than the 12:00 hour’s roughly 75.07 million. The fact that the closing price and same-length trading volume both rose is stronger evidence than just the single intraday touch of that price; however, it only confirms that one hour, and we cannot treat the still-unfinished 14:00 hour’s candlestick as already having “stabilized.”
The third paragraph looks at positioning and information boundaries. The Binance open-position volume sample around 13:00 is about 8.22 million MOVR; at 14:02 the real-time value is about 9.05 million MOVR. Since the sampling time points differ, we can only say that the intraday position size changed noticeably—we can’t conclude that all of it is new long positions. The observed funding rate is about +0.0050%, which also cannot prove a squeeze. The MOVR migration announcements that are publicly checkable occurred in July; there is no verified original information to attribute the two hourly candles in this move to a new announcement today. Next, we should see whether the full 14:00 hour can hold above 2.4550 and whether the trading amount can be maintained. If it closes again below the old upper boundary, then the significance of the 13:00 reclaim on increased volume would need to be reassessed. The chart only uses the 1-hour candlesticks from this Binance cycle that have already been completed.
The first paragraph is a breakdown. The previous post said that during the 11:00 hour it closed at 2.3941, and the 09:00 high at 2.4550 had not yet been confirmed by a complete closing. After that, from 12:00 to 13:00, the price first touched 2.4960, then dipped to 2.0303, and ultimately closed at 2.2343, which is about 6.7% lower than the 11:00 close. During this hour, the USDT trading amount was about 75.07 million, higher than the 11:00 hour by about 36.16 million. After piercing the old high during the session, it closed lower, indicating that high-level turnover and profit taking/backoff occurred at the same time. Increased volume alone cannot be used to infer net capital inflow, nor can it determine the exact liquidation size from the candlesticks.
The second paragraph is the reversal at 13:00. From 13:00 to 14:00, the full hour opened at 2.2343, with a low of 2.2201 and a high of 2.6980, and it finally closed at 2.6639—reclaiming above the old upper boundary at 2.4550 from the previous post that still needed validation, and it is about 8.5% higher than that level. Trading volume for this hour was about 97.67 million, about 30% higher than the 12:00 hour’s roughly 75.07 million. The fact that the closing price and same-length trading volume both rose is stronger evidence than just the single intraday touch of that price; however, it only confirms that one hour, and we cannot treat the still-unfinished 14:00 hour’s candlestick as already having “stabilized.”
The third paragraph looks at positioning and information boundaries. The Binance open-position volume sample around 13:00 is about 8.22 million MOVR; at 14:02 the real-time value is about 9.05 million MOVR. Since the sampling time points differ, we can only say that the intraday position size changed noticeably—we can’t conclude that all of it is new long positions. The observed funding rate is about +0.0050%, which also cannot prove a squeeze. The MOVR migration announcements that are publicly checkable occurred in July; there is no verified original information to attribute the two hourly candles in this move to a new announcement today. Next, we should see whether the full 14:00 hour can hold above 2.4550 and whether the trading amount can be maintained. If it closes again below the old upper boundary, then the significance of the 13:00 reclaim on increased volume would need to be reassessed. The chart only uses the 1-hour candlesticks from this Binance cycle that have already been completed.