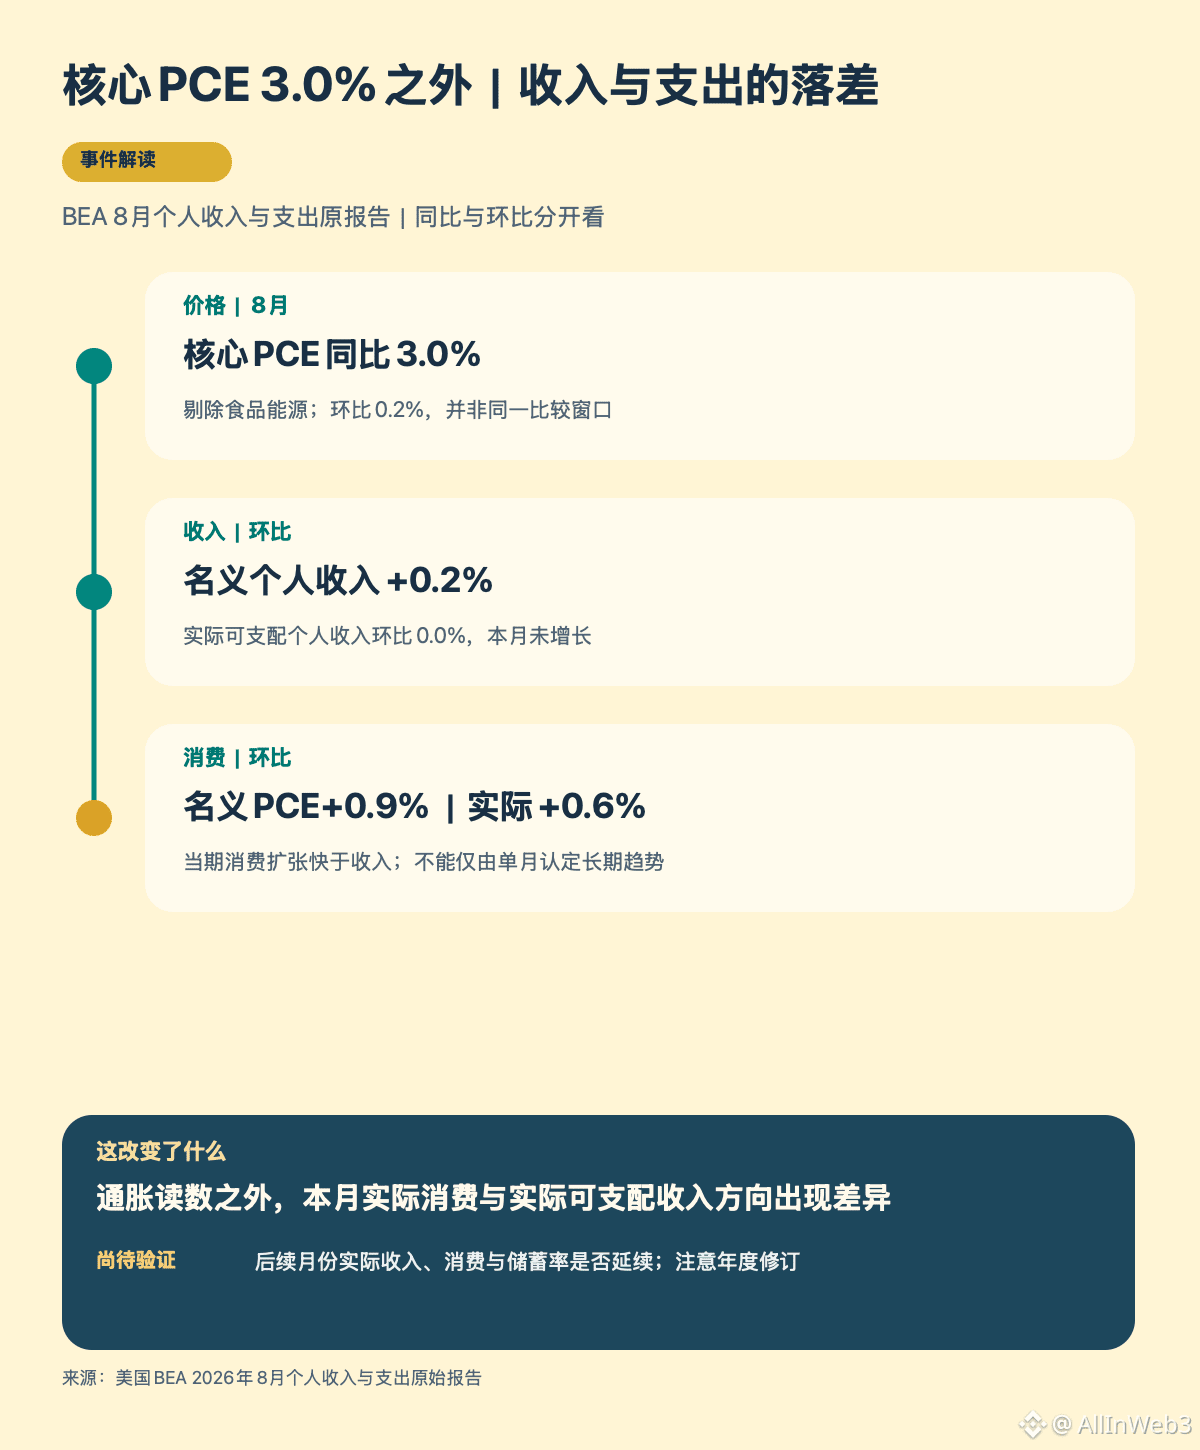
#U.S. August core PCE falls to 3%, corresponding to the August report released on September 30 by the Bureau of Economic Analysis (BEA). The 3.0% in the headline refers to the year-over-year price increase excluding food and energy; it is not data from the latest period. In this account’s post at 23:44 on September 30 (post ID 372293189695517), the author explained core vs. headline (overall) and year-over-year vs. month-over-month, and also mentioned actual consumption and the savings rate. At 13:42 on October 1 Beijing time, I rechecked the original BEA report. This article only fills in the income and consumption gaps that were not expanded in the prior post: when consumption grows, is residents’ real disposable income also growing?
Step one: align the comparison windows. In August, nominal personal income rose 0.2% month-over-month; nominal disposable income after personal taxes rose 0.3%. After adjusting for prices, real disposable income was flat at 0.0% month-over-month. In the same report, nominal personal consumption expenditures (PCE) rose 0.9% month-over-month, while real PCE rose 0.6%. This implies that the quantity of consumption increased, but real disposable income did not increase in sync. You cannot simply subtract nominal income 0.2% from real consumption 0.6%, nor can you mix the year-over-year core inflation 3.0% into a monthly comparison.
Step two: examine the composition of spending. BEA reported that nominal PCE in August increased by $190.8 billion. Goods spending increased by $114.1 billion, and services spending increased by $76.7 billion. Together, the two items sum to the total nominal increase; they cannot directly represent the actual quantities of goods and services consumed, nor can they indicate how much prices for each category rose. The savings rate for the month was 4.1%, but based on only a single month’s income, consumption, and savings rate, it is impossible to prove that households are continuously drawing down savings or that future consumption will definitely slow down.
Step three: clarify the revision boundaries. BEA also performed an annual update to the national accounts this time; revisions to monthly estimates of personal income and spending can be traced back to January 2021. Use the same version of the series to compare the months before and after. Real income was unchanged while real consumption grew in August—relative to the previous post, this is a new angle worth tracking separately—but it still reflects only one month of observation, so it cannot directly be used to infer Federal Reserve decisions or the direction of BTC. In the next observation, we will see whether real disposable income, real consumption, and the savings rate continue to move in the same direction; then we will update the conclusion. In the chart, all percentages are clearly labeled as year-over-year or month-over-month.
Step one: align the comparison windows. In August, nominal personal income rose 0.2% month-over-month; nominal disposable income after personal taxes rose 0.3%. After adjusting for prices, real disposable income was flat at 0.0% month-over-month. In the same report, nominal personal consumption expenditures (PCE) rose 0.9% month-over-month, while real PCE rose 0.6%. This implies that the quantity of consumption increased, but real disposable income did not increase in sync. You cannot simply subtract nominal income 0.2% from real consumption 0.6%, nor can you mix the year-over-year core inflation 3.0% into a monthly comparison.
Step two: examine the composition of spending. BEA reported that nominal PCE in August increased by $190.8 billion. Goods spending increased by $114.1 billion, and services spending increased by $76.7 billion. Together, the two items sum to the total nominal increase; they cannot directly represent the actual quantities of goods and services consumed, nor can they indicate how much prices for each category rose. The savings rate for the month was 4.1%, but based on only a single month’s income, consumption, and savings rate, it is impossible to prove that households are continuously drawing down savings or that future consumption will definitely slow down.
Step three: clarify the revision boundaries. BEA also performed an annual update to the national accounts this time; revisions to monthly estimates of personal income and spending can be traced back to January 2021. Use the same version of the series to compare the months before and after. Real income was unchanged while real consumption grew in August—relative to the previous post, this is a new angle worth tracking separately—but it still reflects only one month of observation, so it cannot directly be used to infer Federal Reserve decisions or the direction of BTC. In the next observation, we will see whether real disposable income, real consumption, and the savings rate continue to move in the same direction; then we will update the conclusion. In the chart, all percentages are clearly labeled as year-over-year or month-over-month.