🔥 $ETC Sitting on Critical Support — Reversal or Another Breakdown?
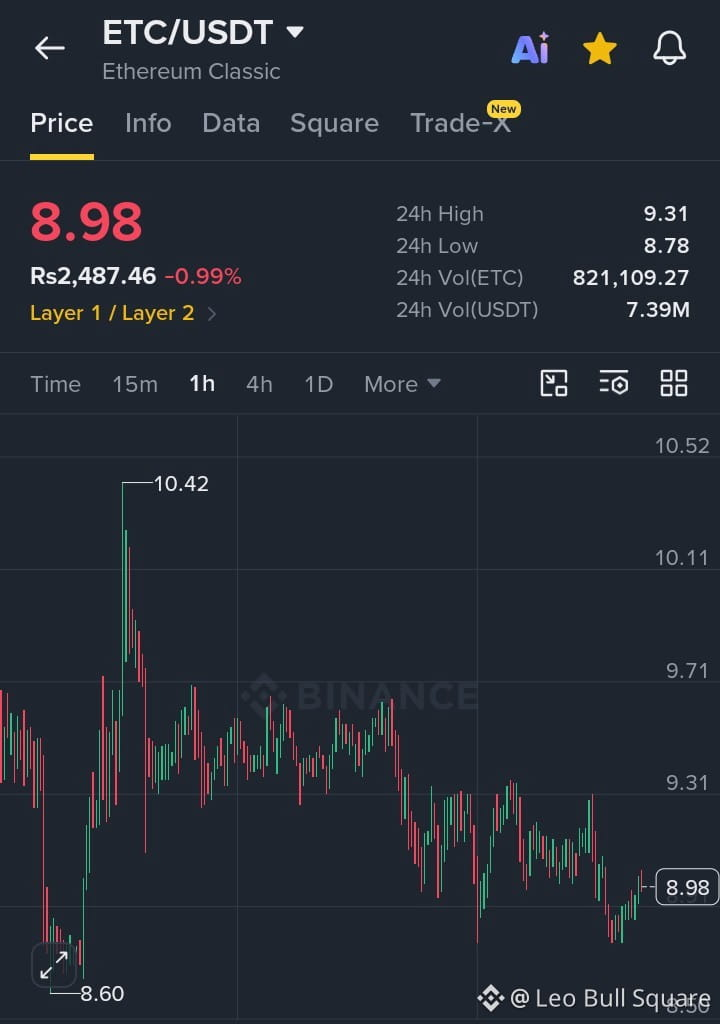
$ETC /USDT is trading near $8.98 (-0.99%) on the 1H chart after a prolonged pullback from the $10.42 swing high, with the structure still showing lower highs and continued selling pressure; however, buyers are attempting to defend the $8.78–$8.90 support zone. A sustained reclaim above $9.05–$9.10 could create a short-term long opportunity, with Entry: $8.90–$9.02 | TP1: $9.15 | TP2: $9.31 | TP3: $9.50 | Stop Loss: below $8.76. The key confirmation is a strong 1H candle and rising volume above $9.10; failure to hold $8.78 would invalidate the bounce setup and could expose the $8.60–$8.50 area. 24H High: $9.31 | Low: $8.78 | Volume: 821.11K ETC / $7.39M USDT — watch the support reaction closely before entering.
#ETC
$ETC /USDT is trading near $8.98 (-0.99%) on the 1H chart after a prolonged pullback from the $10.42 swing high, with the structure still showing lower highs and continued selling pressure; however, buyers are attempting to defend the $8.78–$8.90 support zone. A sustained reclaim above $9.05–$9.10 could create a short-term long opportunity, with Entry: $8.90–$9.02 | TP1: $9.15 | TP2: $9.31 | TP3: $9.50 | Stop Loss: below $8.76. The key confirmation is a strong 1H candle and rising volume above $9.10; failure to hold $8.78 would invalidate the bounce setup and could expose the $8.60–$8.50 area. 24H High: $9.31 | Low: $8.78 | Volume: 821.11K ETC / $7.39M USDT — watch the support reaction closely before entering.
#ETC