$S near 3.0 hours of position increase by 5.2%. Someone is building a position
$CAP half an hour net buy of 1.02 million, volume expands to 5.7x
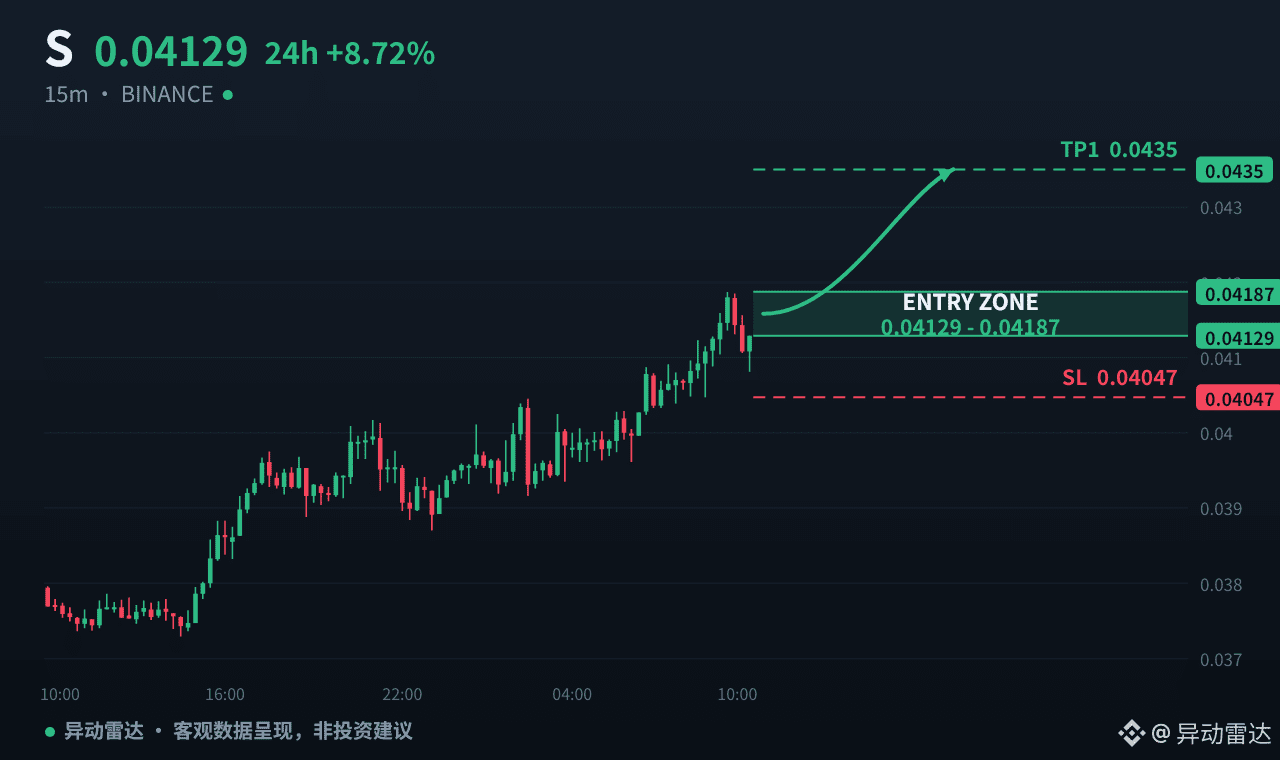
💰 S 0.04129 slightly bullish
🟢 holds steady at 0.04147
Target 0.04187 / 0.04205 / 0.04223
Stop loss 0.04056
🔴 breaks below 0.04047
Look for 0.03961 / 0.03935
🧠 【Operator battle—qualitative assessment】:The large trader long/short ratio is as high as 2.18 and positions have surged by +5.20% over 3.0 hours; positions jumped sharply by +5.3% in 1 hour. The chips are extremely tilted toward the longs. The funding rate remains negative at -0.0108%, indicating the shorts are still resisting and paying interest to the longs. The main force is using a spike in OI to force the left-side shorts to get stopped out; currently, the market is in a long-led reflexive acceleration phase pushing upward.
📊 【Candlestick structure and momentum】:The half-hour volume energy expands to 1.1x, along with a net inflow of 235,500 USDT. Longs dominate active trades. After price hit a 24H new high of 0.04167, it is approaching overhead resistance at 0.04187. ATR(14) is only 0.000455, meaning volatility is extremely low. This is a typical right-side impulse breakout pattern with volume and price rising in sync, building up and ready to move.
🚀 【Key levels for right-side follow orders】:You must wait for price to break out with volume above 0.04187 and for the half-hour volume energy to stay above 1.2x before chasing longs in trend. Hold the stop loss firmly at 0.04047 below support. For right-side trading, don’t guess the top—right-side breakout discipline means if support is broken, exit unconditionally; never “hold and hope.”
💡 【Practical execution instructions】:Order-book capital shows a net inflow of 235,500 USDT; aggressive buying is strong. Positions rising together with a surge in OI indicates main capital is still entering. Use a right-side breakout strategy: after holding above 0.04147, chase longs with a light position; stop loss is strictly set at 0.04047; position sizing must stay within 5% of total capital—no full-cap hard holding.
━━━━━━━━━
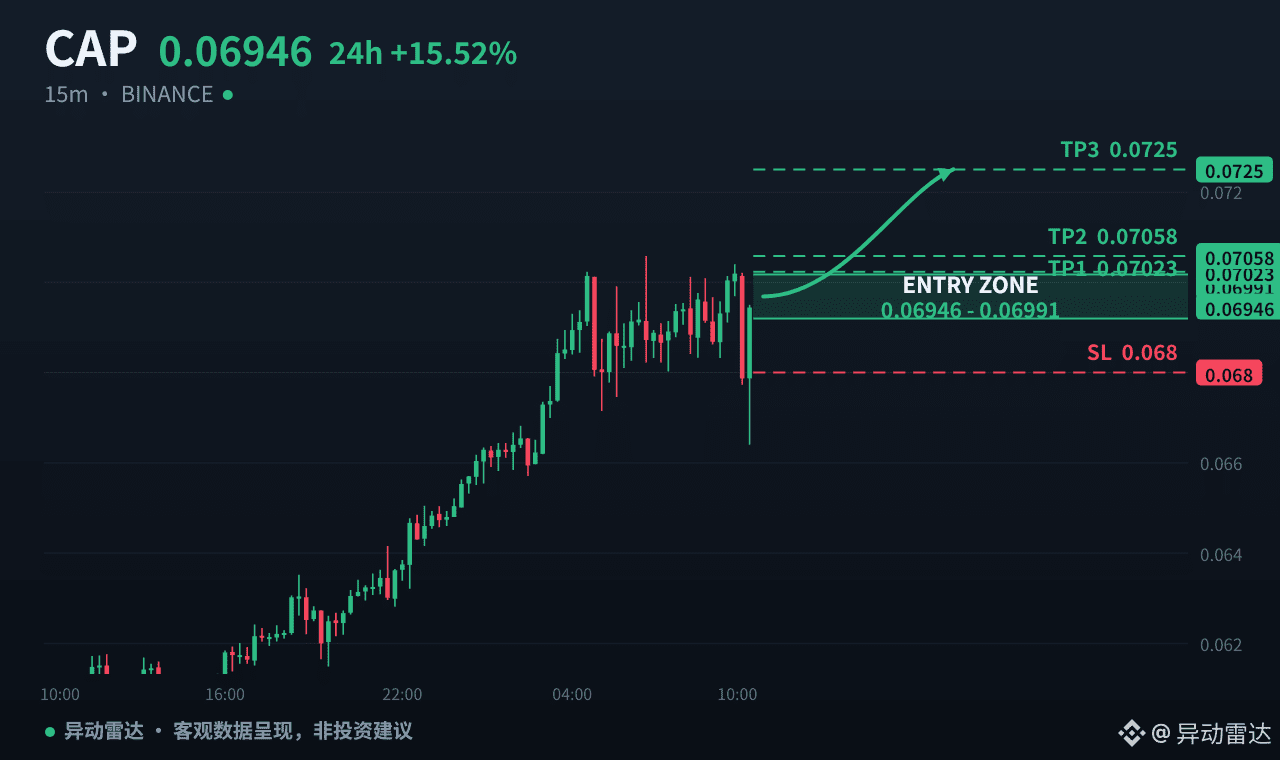
💰 CAP 0.06946 slightly bullish
🟢 holds steady at 0.06991
Target 0.07023 / 0.07058 / 0.07250
Stop loss 0.06800
🔴 breaks below 0.06833
Look for 0.06802 / 0.06715
🧠 【Operator battle—qualitative assessment】:Half-hour volume energy expands to 5.7x, net inflow is 1.0241 million USDT. The large trader long/short ratio is 1.44, but the active trade ratio is only 0.59. This suggests when the longs lift price, they encounter passive selling pressure. The long/short reflexive contest is intense; the main force is luring retail to chase with a higher funding rate of +0.0372%, while harvesting the chips that jumped on too early on the right side.
📊 【Candlestick structure and momentum】:24H increase of 15.52%. After a rapid drop of -3.20% in 5 minutes, a structural reversal rebound of +3.02% was triggered. The current price 0.06946 is pressing close to overhead resistance 0.06991. Volume matches net inflows, fitting the right-side breakout precursor of consolidation building up at high levels, with support at 0.06833 forming an effective defense line.
🚀 【Key levels for right-side follow orders】:Only when there is a volume-backed hold above 0.06991 and the active trade ratio warms back up can you confirm the right-side breakout-and-chase signal. Set stop loss at 0.06800. Right-side trading only recognizes order-book breakout discipline—never blindly catch a falling knife from the left.
💡 【Practical execution instructions】:Net inflow at the order book combined with 5.7x volume energy shows longs still have room. However, the low active trade ratio of 0.59 warns that selling pressure is heavy. Strategy: wait for a volume-backed breakout of 0.06991, then light-position follow long on the right side. Targets are directly at 0.07058 and above. Stop loss 0.06800. Position sizing must be strictly within 5% of total capital; if the key level is not broken, it’s better to observe from the sidelines.
—
🕒 Data from 10-01 10:11 (UTC+8), Binance futures market; verify as you like
Objective data is presented, not investment advice—watch for risks.
#S #CAP
$CAP half an hour net buy of 1.02 million, volume expands to 5.7x
💰 S 0.04129 slightly bullish
🟢 holds steady at 0.04147
Target 0.04187 / 0.04205 / 0.04223
Stop loss 0.04056
🔴 breaks below 0.04047
Look for 0.03961 / 0.03935
🧠 【Operator battle—qualitative assessment】:The large trader long/short ratio is as high as 2.18 and positions have surged by +5.20% over 3.0 hours; positions jumped sharply by +5.3% in 1 hour. The chips are extremely tilted toward the longs. The funding rate remains negative at -0.0108%, indicating the shorts are still resisting and paying interest to the longs. The main force is using a spike in OI to force the left-side shorts to get stopped out; currently, the market is in a long-led reflexive acceleration phase pushing upward.
📊 【Candlestick structure and momentum】:The half-hour volume energy expands to 1.1x, along with a net inflow of 235,500 USDT. Longs dominate active trades. After price hit a 24H new high of 0.04167, it is approaching overhead resistance at 0.04187. ATR(14) is only 0.000455, meaning volatility is extremely low. This is a typical right-side impulse breakout pattern with volume and price rising in sync, building up and ready to move.
🚀 【Key levels for right-side follow orders】:You must wait for price to break out with volume above 0.04187 and for the half-hour volume energy to stay above 1.2x before chasing longs in trend. Hold the stop loss firmly at 0.04047 below support. For right-side trading, don’t guess the top—right-side breakout discipline means if support is broken, exit unconditionally; never “hold and hope.”
💡 【Practical execution instructions】:Order-book capital shows a net inflow of 235,500 USDT; aggressive buying is strong. Positions rising together with a surge in OI indicates main capital is still entering. Use a right-side breakout strategy: after holding above 0.04147, chase longs with a light position; stop loss is strictly set at 0.04047; position sizing must stay within 5% of total capital—no full-cap hard holding.
━━━━━━━━━
💰 CAP 0.06946 slightly bullish
🟢 holds steady at 0.06991
Target 0.07023 / 0.07058 / 0.07250
Stop loss 0.06800
🔴 breaks below 0.06833
Look for 0.06802 / 0.06715
🧠 【Operator battle—qualitative assessment】:Half-hour volume energy expands to 5.7x, net inflow is 1.0241 million USDT. The large trader long/short ratio is 1.44, but the active trade ratio is only 0.59. This suggests when the longs lift price, they encounter passive selling pressure. The long/short reflexive contest is intense; the main force is luring retail to chase with a higher funding rate of +0.0372%, while harvesting the chips that jumped on too early on the right side.
📊 【Candlestick structure and momentum】:24H increase of 15.52%. After a rapid drop of -3.20% in 5 minutes, a structural reversal rebound of +3.02% was triggered. The current price 0.06946 is pressing close to overhead resistance 0.06991. Volume matches net inflows, fitting the right-side breakout precursor of consolidation building up at high levels, with support at 0.06833 forming an effective defense line.
🚀 【Key levels for right-side follow orders】:Only when there is a volume-backed hold above 0.06991 and the active trade ratio warms back up can you confirm the right-side breakout-and-chase signal. Set stop loss at 0.06800. Right-side trading only recognizes order-book breakout discipline—never blindly catch a falling knife from the left.
💡 【Practical execution instructions】:Net inflow at the order book combined with 5.7x volume energy shows longs still have room. However, the low active trade ratio of 0.59 warns that selling pressure is heavy. Strategy: wait for a volume-backed breakout of 0.06991, then light-position follow long on the right side. Targets are directly at 0.07058 and above. Stop loss 0.06800. Position sizing must be strictly within 5% of total capital; if the key level is not broken, it’s better to observe from the sidelines.
—
🕒 Data from 10-01 10:11 (UTC+8), Binance futures market; verify as you like
Objective data is presented, not investment advice—watch for risks.
#S #CAP