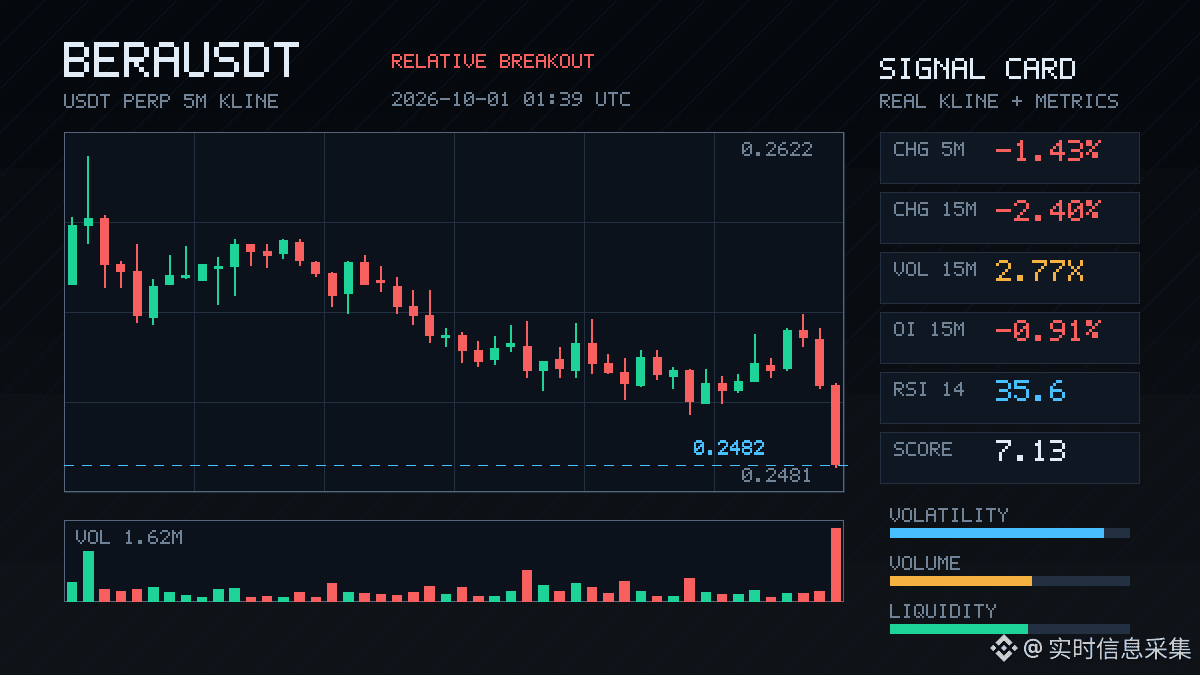
$BERA This drop came a bit fast.
On the 15m chart, it’s down -2.40% directly. Volume is up to 2.77x, and the volatility “Z” hits 3.56. This isn’t a normal pullback—it looks like someone is urgently exiting. The close broke below the lower band of the last ~20 5m candles, so any stop-losses from chasing longs likely got swept in a round.
Key thing to watch: OI. On 15m, OI is -0.91%; on 1h, it’s -1.95%. That’s nominally a loss of more than 270k U. Price is falling while OI is also dropping—this doesn’t look like new shorts entering. It looks more like longs deleveraging, cutting positions and getting out. Active volume is down -36.6%, and the buy/sell ratio is 0.46. Sell pressure is one-sided—but it feels more like being passively beaten than actively smashed.
The OI abnormal percentile is 94.6%, at pool #10, which means position changes at this level are already extremely extreme. In the past 24h, turnover is 52M; liquidity isn’t bad. But just now, that move confirmed the depth—volume is there, and the direction is there too.
Now the question is: has the deleveraging finished? If OI keeps dropping and price grinds along the lower boundary of the range, there could be a second wave. If, instead, it stops falling on reduced volume, then this is more of an observation point. Don’t rush to buy the dip—wait until the sell pressure is exhausted.
On the 15m chart, it’s down -2.40% directly. Volume is up to 2.77x, and the volatility “Z” hits 3.56. This isn’t a normal pullback—it looks like someone is urgently exiting. The close broke below the lower band of the last ~20 5m candles, so any stop-losses from chasing longs likely got swept in a round.
Key thing to watch: OI. On 15m, OI is -0.91%; on 1h, it’s -1.95%. That’s nominally a loss of more than 270k U. Price is falling while OI is also dropping—this doesn’t look like new shorts entering. It looks more like longs deleveraging, cutting positions and getting out. Active volume is down -36.6%, and the buy/sell ratio is 0.46. Sell pressure is one-sided—but it feels more like being passively beaten than actively smashed.
The OI abnormal percentile is 94.6%, at pool #10, which means position changes at this level are already extremely extreme. In the past 24h, turnover is 52M; liquidity isn’t bad. But just now, that move confirmed the depth—volume is there, and the direction is there too.
Now the question is: has the deleveraging finished? If OI keeps dropping and price grinds along the lower boundary of the range, there could be a second wave. If, instead, it stops falling on reduced volume, then this is more of an observation point. Don’t rush to buy the dip—wait until the sell pressure is exhausted.