【Oct 1】 $XAU
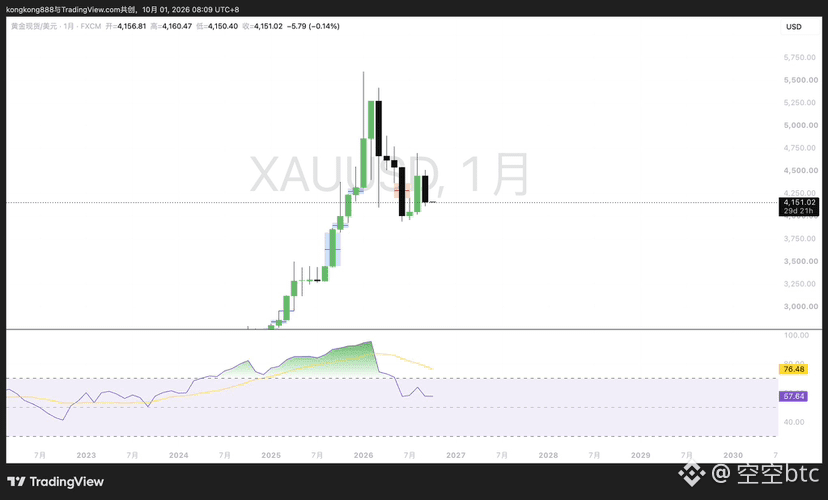
On the monthly line level, a bearish candle formed (closing lower). The closing is within the preceding K-line, and the prior K-line’s upward gap has not been fully filled; it looks relatively weak. The liquidity around the bottom at 3941 is attractive. Overall, the bottom is rising (moving higher), while the highs are lowering; the pattern also suggests a possibility of convergence.
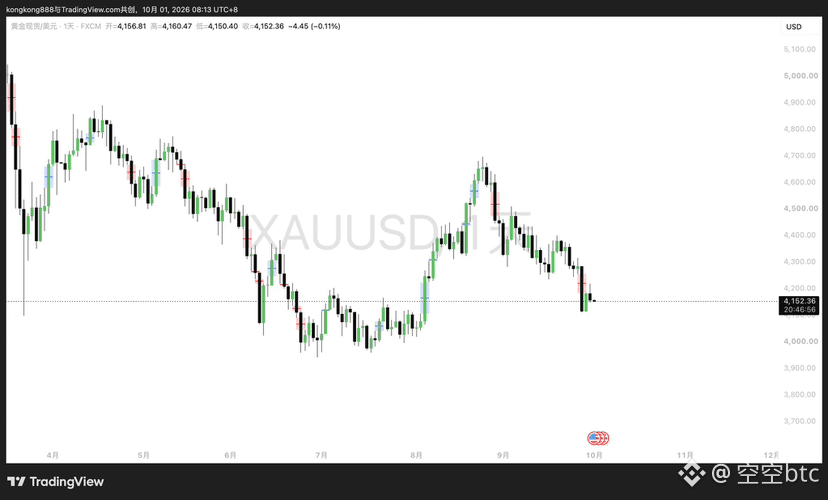
At the daily line level, the market is in a downward trend. A long upper-wick bearish candle formed, which doesn’t look very good. The area around 4220—where the high pulled back to and turned around near the support/resistance swap level—met resistance and fell again. The parallel low around 4110 is a likely destination for price.
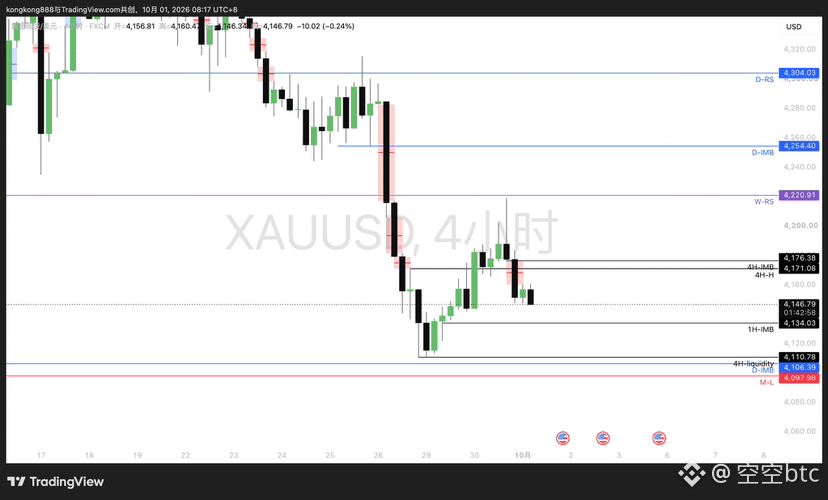
At the 4-hour level, the structure is bearish. Yesterday during the day it rebounded, but in the evening the decline started. Near 4220 it met resistance again and then formed a “shooting hammer”/inverted hammer-type candle, followed by further selling. A downside gap was left around 4175. Going forward, as long as 4110 hasn’t been taken out (not broken through and cleared), if there’s an opportunity to rise again, you can try to short. Once 4110 is taken out, the logic changes. In terms of pattern, it may form a W-bottom after taking out 4110, or it may break down and continue lower instead—basically these two paths.
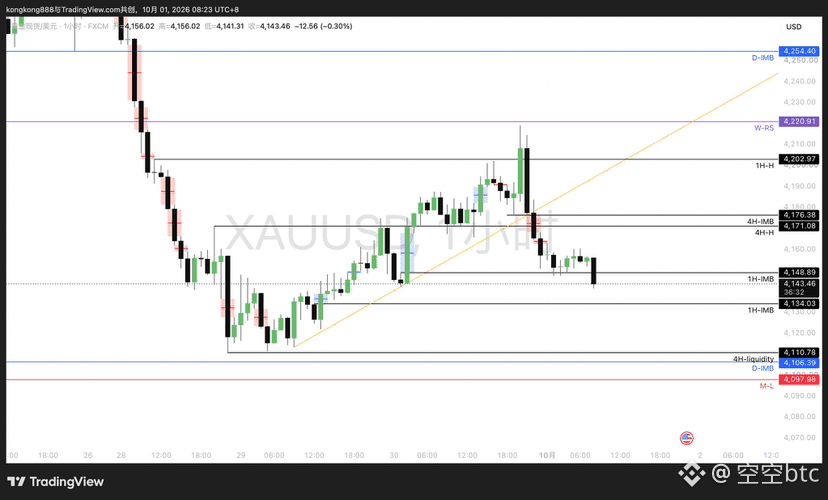
At the 1-hour level (right-side structure), the market broke below the short-term rising trendline. After a retest of the 1-hour upward gap at 4148, there was a small rebound, but it has since broken down again—showing weakness. The next target zones are 4143/4110.
#黄金
On the monthly line level, a bearish candle formed (closing lower). The closing is within the preceding K-line, and the prior K-line’s upward gap has not been fully filled; it looks relatively weak. The liquidity around the bottom at 3941 is attractive. Overall, the bottom is rising (moving higher), while the highs are lowering; the pattern also suggests a possibility of convergence.
At the daily line level, the market is in a downward trend. A long upper-wick bearish candle formed, which doesn’t look very good. The area around 4220—where the high pulled back to and turned around near the support/resistance swap level—met resistance and fell again. The parallel low around 4110 is a likely destination for price.
At the 4-hour level, the structure is bearish. Yesterday during the day it rebounded, but in the evening the decline started. Near 4220 it met resistance again and then formed a “shooting hammer”/inverted hammer-type candle, followed by further selling. A downside gap was left around 4175. Going forward, as long as 4110 hasn’t been taken out (not broken through and cleared), if there’s an opportunity to rise again, you can try to short. Once 4110 is taken out, the logic changes. In terms of pattern, it may form a W-bottom after taking out 4110, or it may break down and continue lower instead—basically these two paths.
At the 1-hour level (right-side structure), the market broke below the short-term rising trendline. After a retest of the 1-hour upward gap at 4148, there was a small rebound, but it has since broken down again—showing weakness. The next target zones are 4143/4110.
#黄金