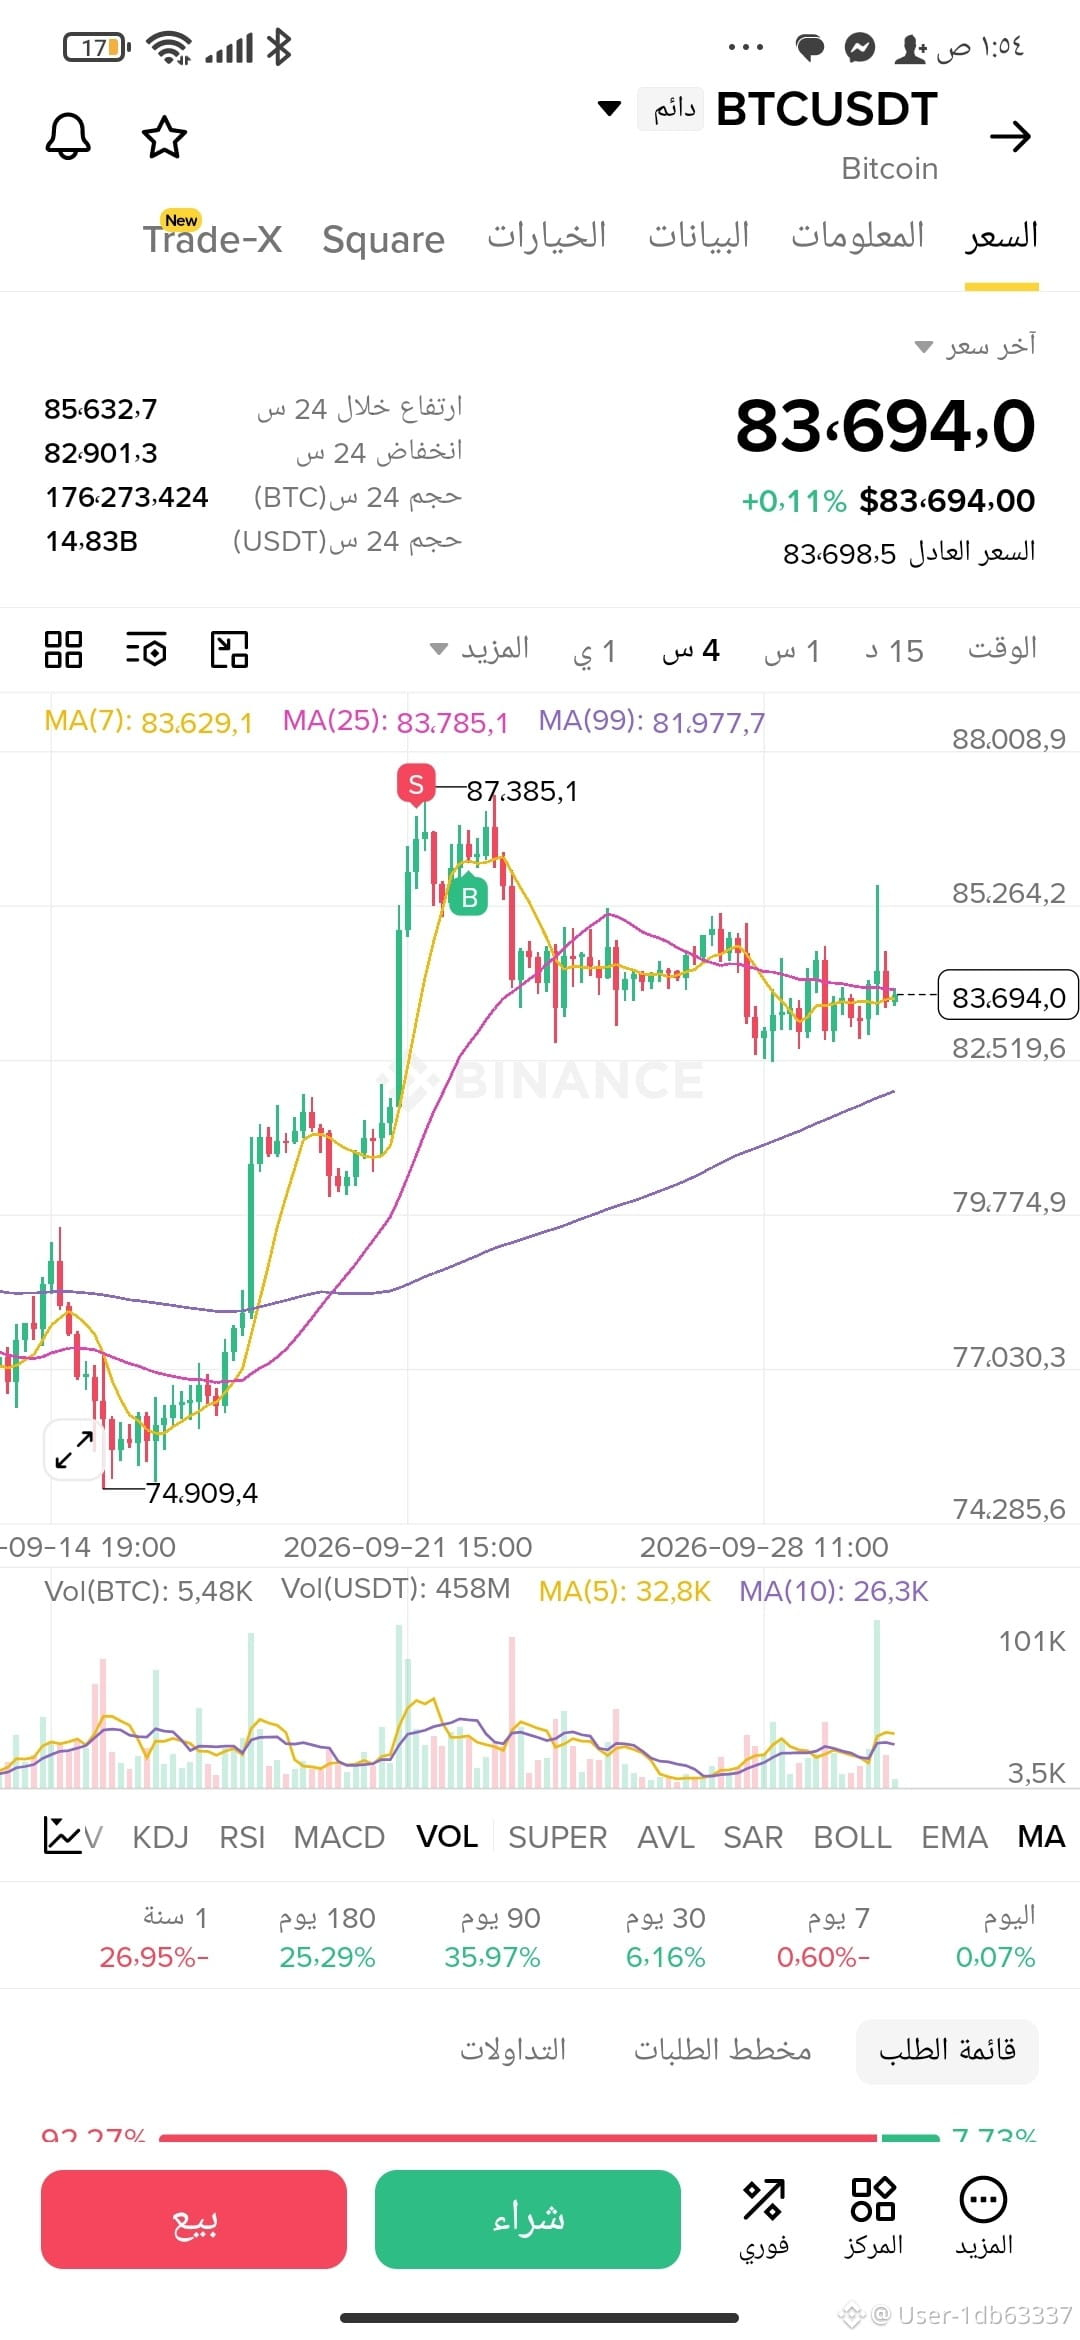
Bitcoin Price Movement Analysis #BTC on the 4-Hour Chart with the Start of October 🚀
BTC/USDT is currently trading around the $83,694 levels, where the technical chart shows solid consolidation above the recent ascending support levels formed after the bottom at $74,909.
💡 Quick technical reading based on the chart:
Moving Averages: The price is currently trading near the short- and medium-term moving averages (MA7 and MA25), indicating an accumulation phase with temporary sideways fluctuation.
Near Resistance: Breaking through the nearby resistance levels and holding above them will refocus on retesting the last high achieved around $87,385.
Current Support: Staying stable above the $82,500 zones supports maintaining a positive outlook for the final quarter of the year.
#CryptocurrencyWealth
#TradingTales
#Binance
#BTCUSDT.
BTC/USDT is currently trading around the $83,694 levels, where the technical chart shows solid consolidation above the recent ascending support levels formed after the bottom at $74,909.
💡 Quick technical reading based on the chart:
Moving Averages: The price is currently trading near the short- and medium-term moving averages (MA7 and MA25), indicating an accumulation phase with temporary sideways fluctuation.
Near Resistance: Breaking through the nearby resistance levels and holding above them will refocus on retesting the last high achieved around $87,385.
Current Support: Staying stable above the $82,500 zones supports maintaining a positive outlook for the final quarter of the year.
#CryptocurrencyWealth
#TradingTales
#Binance
#BTCUSDT.