


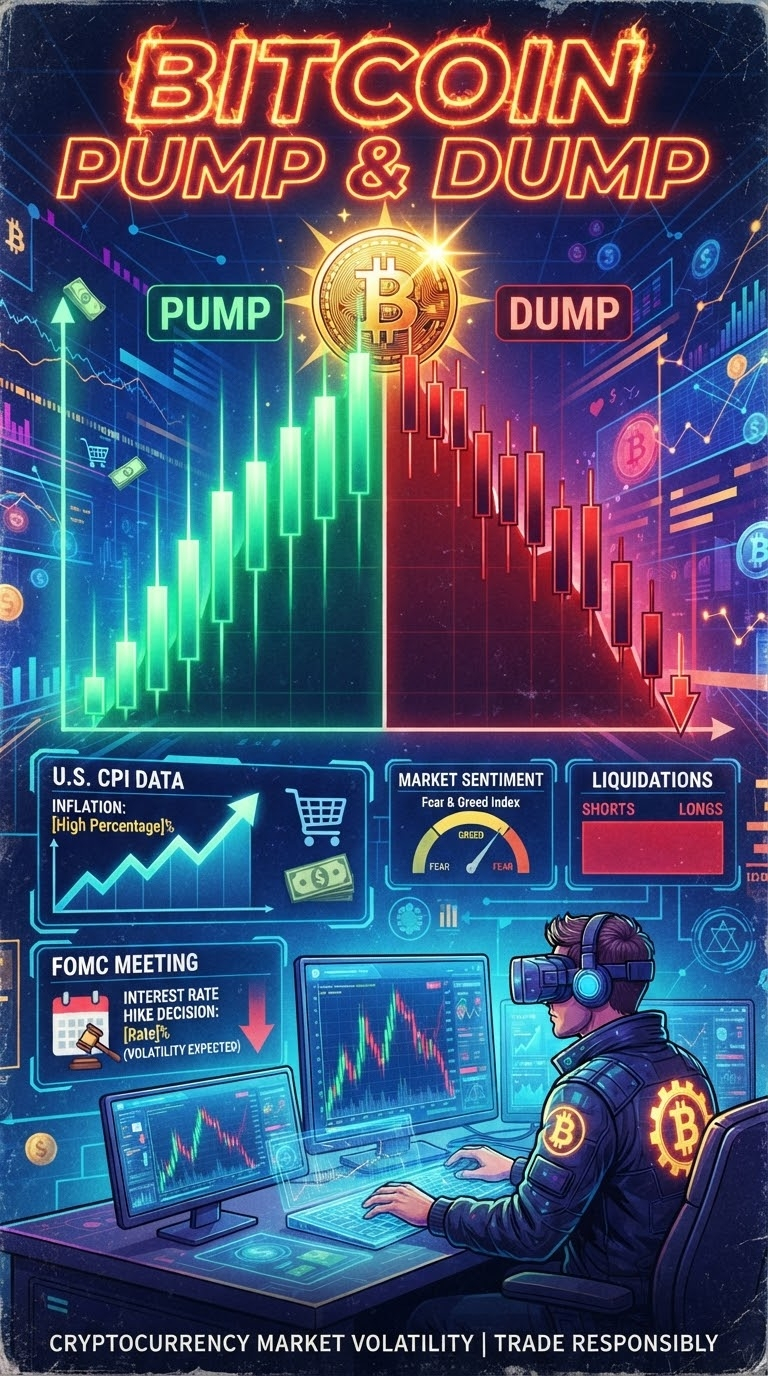
 The most important roles behind Pump (price increase) or Dump (price drop) in the Bitcoin (BTC) market are macroeconomics and institutional fund flows. Below is a detailed and engaging analysis of how these indicators influence Bitcoin price action:
1. US CPI (Consumer Price Index - consumer price index)
CPI (Consumer Price Index) is the primary measure of inflation in the United States. It directly controls the market’s risk appetite.
Probability of Pump: If the released CPI data comes in lower than the market’s forecast, it signals cooling inflation. This gives the Fed (FED) the opportunity to cut interest rates or adopt a more flexible policy. As the possibility of increased dollar inflows arises, you often see big Pumps in risk assets, including Bitcoin.
Probability of Dump: If CPI comes in higher than expected (Hot Inflation), it creates fears that interest rates will stay high for a long time. As a result, the dollar and bond yields strengthen, and capital flows out of the crypto market, leading to a sharp Dump.
2. FOMC Decision (Federal Open Market Committee’s interest rate decision)
The central bank’s interest rate decision in the U.S. and the Fed Chair’s policy statement set the medium- and long-term trend for the crypto market.
Probability of Pump: If the Fed cuts interest rates (Rate Cut) or signals a more flexible future policy (Dovish Stance), liquidity increases in the global financial markets. A large portion of this excess liquid money flows into the crypto market and creates a strong bullish run or Pump.
Probability of Dump: If the Fed keeps interest rates unchanged or announces that it will be more strict in controlling inflation (Hawkish Stance), it creates an immediate 'risk-off' mood in the market and accelerates a drop or Dump.
3. BTC ETF Flow (spot Bitcoin exchange-traded fund flow)
This is the biggest dynamic driver of current crypto market supply and demand. Spot Bitcoin ETFs from BlackRock, Fidelity, etc. show real-time institutional demand through daily inflows or outflows.
Probability of Pump: If over several consecutive business days the ETFs record large net inflows, it means traditional institutional investors are pouring in cash. ETF issuers, in turn, must buy and hold Bitcoin from the real market, which reduces the free-float supply on exchanges; under order pressure, the price quickly Pump upward.
Probability of Dump: If capital keeps flowing out from the ETF (Net Outflow), it becomes clear that institutions are booking profits or cutting positions. This outflow creates panic in the market and can lead to a large Dump.
4. NFP Report (Non-Farm Payrolls - non-farm employment report)
In order to understand the health of the U.S. labor market and the pace of economic growth, the NFP (Non-Farm Payrolls) report is released in the first week of every month.
Probability of Pump: If the NFP data comes in a way that indicates the economy is not overheating, but instead is on a 'soft landing' path—and the unemployment rate is rising at a manageable level (which would allow the Fed to cut rates)—then Bitcoin gets a positive boost.
Probability of Dump: If the NFP report comes in much stronger than market expectations, it makes it harder for the Fed to lower interest rates. On the other hand, if the data is extremely weak, it raises recession concerns—under both scenarios, the market may fall victim to a Dump in the initial reaction.
Coordinated role and conclusion
These macro indicators don’t work in isolation; rather, they complement each other:
Macro Triggers (CPI & NFP): Inflation and employment data mostly determine what the Fed’s next FOMC Decision will be.
Policy Impact (FOMC): The Fed’s decision determines whether liquidity will increase or decrease in the global market.
Institutional Reaction (BTC ETF Flow): Once the macro environment is understood, institutional investors quickly move money in or out through ETFs, which directly turns into Pump or Dump on the Bitcoin chart.
There are specific trusted platforms and tools to know and track accurate information in real time about crypto market Pumps and Dumps or macroeconomic data (US CPI, FOMC, ETF Flow, NFP). Below is a guideline on where to get which information and how to collect it:
1. US CPI (Consumer Price Index) and NFP (Non-farm employment) data
Where to find out: Use the official website of the U.S. Bureau of Labor Statistics (BLS) or economic calendar platforms such as Investing.com, ForexFactory, and TradingView.
How to know: Go to the 'Economic Calendar' section on these sites, and you’ll see the exact dates and times (according to Bangladesh time) when CPI and NFP are released for each month. As soon as they’re published, you’ll find Actual (real data), Forecast (estimate), and Previous (previous data). By comparing the actual data against the forecast, you can understand the market reaction.
2. FOMC Decision (the Federal Reserve’s interest rate decision)
Where to find out: The official Federal Reserve website, Bloomberg, Reuters, or crypto news portals such as CoinDesk and CoinTelegraph.
How to know: The Fed meeting is held a few specific times each year. On the day of the meeting, the interest rate announcement is made late at night or in the early morning in Bangladesh time, followed by a live broadcast of Fed Chair Jerome Powell’s press conference. In addition, you can use the CME FedWatch Tool to track in advance the market’s expectations (e.g., whether rates will be cut or raised) and the percentage probability.
3. BTC ETF Flow (spot Bitcoin ETF flow)
Where to find out: SoSoValue, Farside Investors, or crypto analytics platforms.
How to know: The Farside Investors or SoSoValue websites have a dedicated 'Bitcoin ETF Flow' page. There, you can view, in real time or as daily updates, charts and tables showing the dollar value of daily inflows (Inflow) or outflows (Outflow) for all major ETFs, including BlackRock, Fidelity, Bitwise, and others, along with the amount of Bitcoin.
4. Real-time market sentiment and price action
Where to find out: TradingView (for chart analysis), CoinMarketCap / CoinGecko (for price and volume), and Alternative.me (for the Fear & Greed Index).
How to know: In TradingView, you can open the Bitcoin chart to track technical indicators and liquidity zones. On the other hand, Fear & Greed Index is monitored regularly to understand greed or fear in the crypto market.
By tracking these platforms regularly, it’s possible to get a clear idea about the market’s next major move or Pump-Dump.
Therefore, when trading in the crypto market, you should always track the calendar of these events, because during high-impact news periods, leverage positions can cause unusual volatility or even a liquidation cascade.