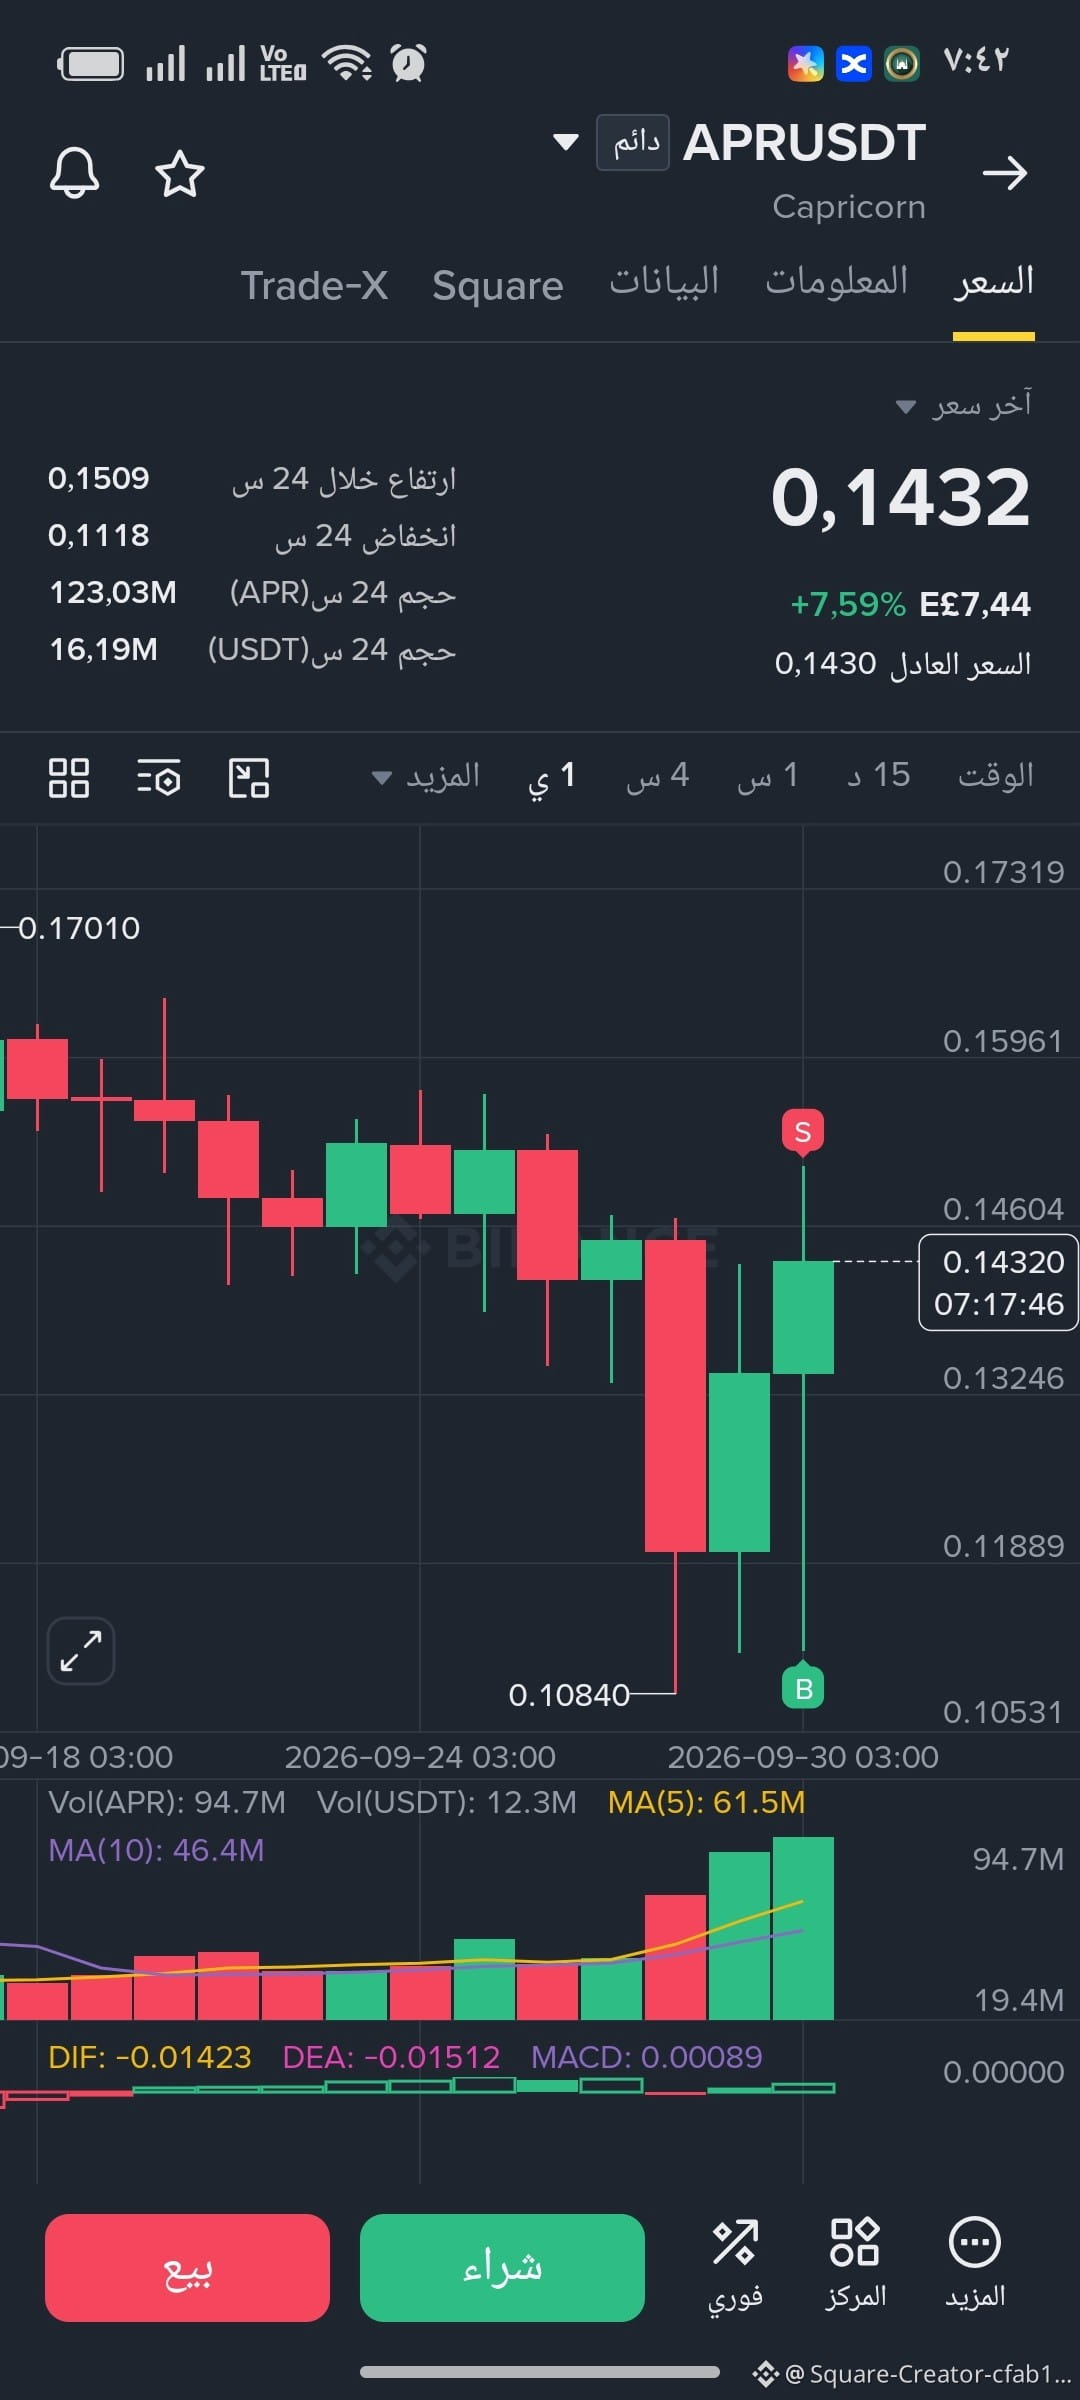
$APR Support and Resistance Levels💵🪙
Next resistance: 0.1460 - 0.1500
(the last candle’s peak zone and the 24-hour high).
Next resistance: 0.1596 - 0.1700
🧿
First support: 0.1324 USDT.
Strong support (the last bottom): 0.1084 USDT.
📊 Technical indicators
Trading volume (Volume):
There is a notable and steady increase in the green volume bars (strong accumulation from the bottom at 0.1084).
Moving averages (MA):
The short-term moving average MA(5) is trending upward, crossing positively with MA(10).
🪙🧿 MACD indicator:
A positive cross near the zero line (DIF above DEA) with the start of green histogram bars appearing, indicating a shift in momentum in favor of buyers. #QNTRises287%
Next resistance: 0.1460 - 0.1500
(the last candle’s peak zone and the 24-hour high).
Next resistance: 0.1596 - 0.1700
🧿
First support: 0.1324 USDT.
Strong support (the last bottom): 0.1084 USDT.
📊 Technical indicators
Trading volume (Volume):
There is a notable and steady increase in the green volume bars (strong accumulation from the bottom at 0.1084).
Moving averages (MA):
The short-term moving average MA(5) is trending upward, crossing positively with MA(10).
🪙🧿 MACD indicator:
A positive cross near the zero line (DIF above DEA) with the start of green histogram bars appearing, indicating a shift in momentum in favor of buyers. #QNTRises287%