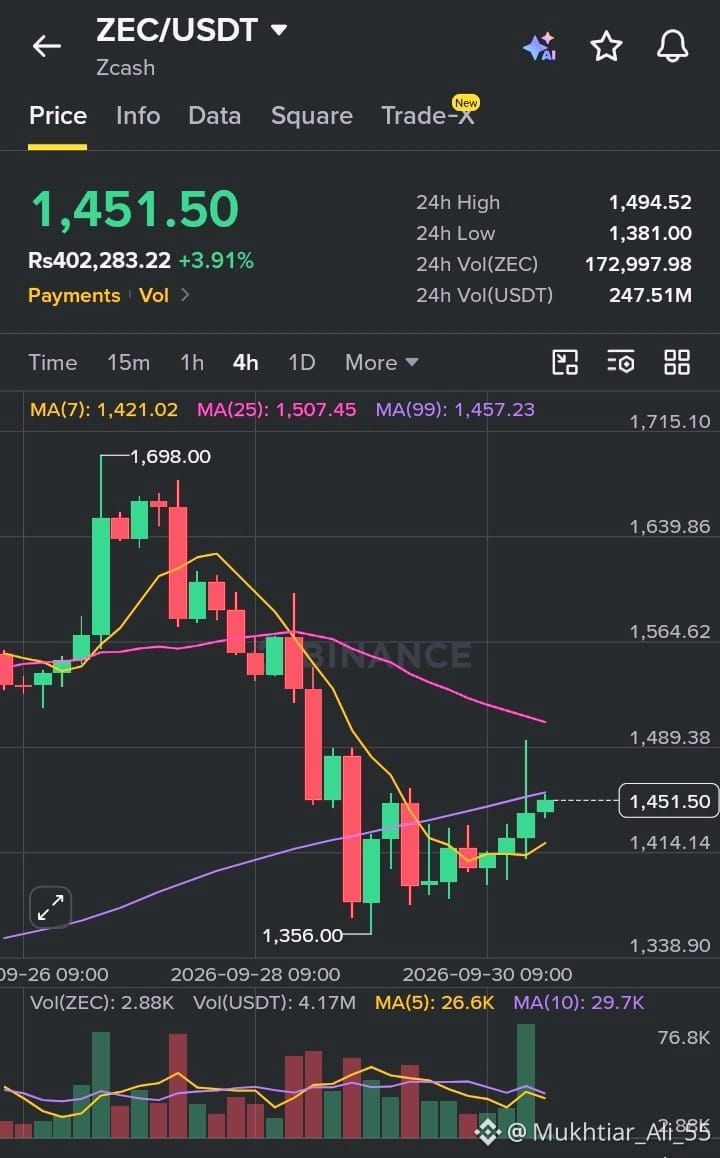
🚨 ZCASH ($ZEC ) SHOWING BULLISH RECOVERY — WHAT THE CHART IS REVEALING 📈🔥
$ZEC | ZEC/USDT
💰 Price: 1,451.50
📈 24H Change: +3.91%
📊 24H High: 1,494.52
📉 24H Low: 1,381.00
💵 24H Volume: 247.51M
⚠️ Market Breakdown (4H Timeframe):
Zcash experienced a solid bullish reversal after sweeping local lows near the 1,356.00 support level 🧨
4H timeframe shows steady recovery candles bouncing off recent bottom consolidation
Strong buying momentum emerging after a period of downward pressure
A sharp green candle indicates buyers stepping back in with active demand 🧲
📉 Moving Averages Overview:
📌 MA(7): 1,421.02
📌 MA(25): 1,507.45
📌 MA(99): 1,457.23
✅ Price has successfully reclaimed MA(7)
❌ Price is trading below MA(25) and MA(99)
✅ Shift in short-term structure turning favor toward bulls 🐂
📊 Volume Insight:
🟢 Noticeable spike in green volume during the recent recovery push
💥 Confirms genuine buying interest rather than a low-volume fakeout
⚠️ Volatility expanding near the key resistance zone
🧠 What This Means:
This isn't just a random bounce ❌
This is a sharp demand response following a local liquidity sweep
🔹 Short-term trend: Bullish Reversal
🔹 Momentum: Strong & Building
🔹 Market emotion: Optimistic / Recovery 📈
🎯 Key Levels to Watch:
🟢 Support: 1,421.00 – 1,356.00 zone
🔴 Resistance: 1,457.20 – 1,507.40 zone
📌 A clean break and close above 1,457.20 (MA 99) opens the path toward 1,507.45 (MA 25) and higher
📌 Failure to clear resistance could lead to retesting MA support around 1,421.00 ⬇️
💡 Final Take:
🧨 ZEC is testing critical resistance after a sharp bullish bounce
🧘 Wait for confirmation above resistance before over-leveraging
🛡️ Smart risk management is key
Markets reward patience and strict execution 💎
#ZEC #CryptoTrading #TechnicalAnalysis #Altcoins #CryptoSignals
$ZEC
$ZEC | ZEC/USDT
💰 Price: 1,451.50
📈 24H Change: +3.91%
📊 24H High: 1,494.52
📉 24H Low: 1,381.00
💵 24H Volume: 247.51M
⚠️ Market Breakdown (4H Timeframe):
Zcash experienced a solid bullish reversal after sweeping local lows near the 1,356.00 support level 🧨
4H timeframe shows steady recovery candles bouncing off recent bottom consolidation
Strong buying momentum emerging after a period of downward pressure
A sharp green candle indicates buyers stepping back in with active demand 🧲
📉 Moving Averages Overview:
📌 MA(7): 1,421.02
📌 MA(25): 1,507.45
📌 MA(99): 1,457.23
✅ Price has successfully reclaimed MA(7)
❌ Price is trading below MA(25) and MA(99)
✅ Shift in short-term structure turning favor toward bulls 🐂
📊 Volume Insight:
🟢 Noticeable spike in green volume during the recent recovery push
💥 Confirms genuine buying interest rather than a low-volume fakeout
⚠️ Volatility expanding near the key resistance zone
🧠 What This Means:
This isn't just a random bounce ❌
This is a sharp demand response following a local liquidity sweep
🔹 Short-term trend: Bullish Reversal
🔹 Momentum: Strong & Building
🔹 Market emotion: Optimistic / Recovery 📈
🎯 Key Levels to Watch:
🟢 Support: 1,421.00 – 1,356.00 zone
🔴 Resistance: 1,457.20 – 1,507.40 zone
📌 A clean break and close above 1,457.20 (MA 99) opens the path toward 1,507.45 (MA 25) and higher
📌 Failure to clear resistance could lead to retesting MA support around 1,421.00 ⬇️
💡 Final Take:
🧨 ZEC is testing critical resistance after a sharp bullish bounce
🧘 Wait for confirmation above resistance before over-leveraging
🛡️ Smart risk management is key
Markets reward patience and strict execution 💎
#ZEC #CryptoTrading #TechnicalAnalysis #Altcoins #CryptoSignals
$ZEC