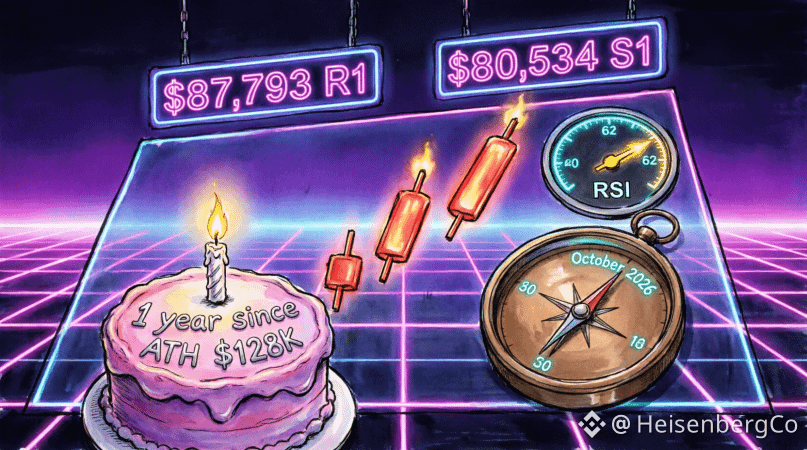
🔷 $BTC technical analysis: October levels and triggers
📋 Facts:
• Price: $83,953 (30.09.2026)
• ATH: $128,198 (06.10.2025), currently -39.8%
• Resistances: $87,793 (R1), $91,212 (R2), $95,052 (R3)
• Supports: $80,534 (S1), $76,694 (S2), $57,877-$64,000 (bottom)
• All timeframes: Strong Buy
• Daily RSI: 62.3 (not overbought)
• Weekly Stoch: 91.5 (overbought)
• Pattern "Three Outside Up" (20.09) — bullish reversal
• Bullish: ETF, halving cycle, the Fed
• Bearish: break below $77k, tightening by the Fed
🧠 My take: The technical picture is mixed. All timeframes are Strong Buy; RSI 62.3 is not overbought; pattern "Three Outside Up" = bullish reversal. But Weekly Stoch 91.5 = overbought, so a pullback to $80k-$81k is likely. October = one year after ATH. Bullish triggers: ETF, halving cycle, a Fed reversal. Bearish: break below $77k, Fed tightening. Base scenario: first a pullback to $80k-$81k, then an assault on $87.8k.
⚠️ Risks: overbought (Weekly Stoch 91.5); correction to $80k-$81k; break below $77k.
❓ First a correction to $80k or straight to the $87.8k push? 👇
#BTC
📋 Facts:
• Price: $83,953 (30.09.2026)
• ATH: $128,198 (06.10.2025), currently -39.8%
• Resistances: $87,793 (R1), $91,212 (R2), $95,052 (R3)
• Supports: $80,534 (S1), $76,694 (S2), $57,877-$64,000 (bottom)
• All timeframes: Strong Buy
• Daily RSI: 62.3 (not overbought)
• Weekly Stoch: 91.5 (overbought)
• Pattern "Three Outside Up" (20.09) — bullish reversal
• Bullish: ETF, halving cycle, the Fed
• Bearish: break below $77k, tightening by the Fed
🧠 My take: The technical picture is mixed. All timeframes are Strong Buy; RSI 62.3 is not overbought; pattern "Three Outside Up" = bullish reversal. But Weekly Stoch 91.5 = overbought, so a pullback to $80k-$81k is likely. October = one year after ATH. Bullish triggers: ETF, halving cycle, a Fed reversal. Bearish: break below $77k, Fed tightening. Base scenario: first a pullback to $80k-$81k, then an assault on $87.8k.
⚠️ Risks: overbought (Weekly Stoch 91.5); correction to $80k-$81k; break below $77k.
❓ First a correction to $80k or straight to the $87.8k push? 👇
#BTC