🌐 Hedera ($HBAR): Structural Recovery and Risk Management After a +57% Surge 📊
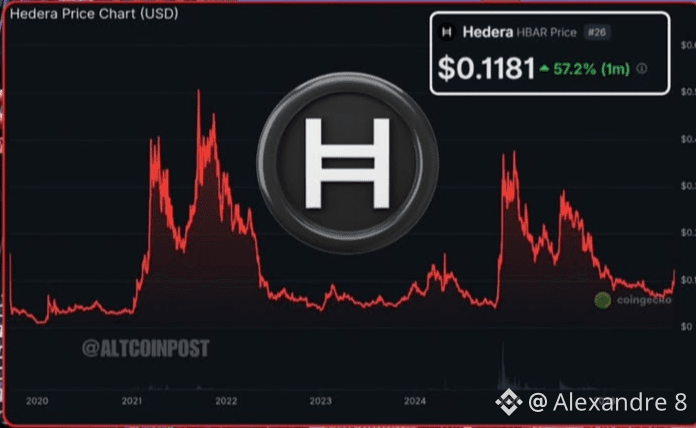
The $HBAR token, Hedera’s native asset, is trading in the range of US$ 0,1181, accumulating a monthly gain of +57.2%. The historical chart shows the asset went through an extended accumulation phase in the previous years, and now it is attempting a meaningful recovery from its bottom.
To serve both institutional and retail audiences on Binance Square, the analysis should balance the project’s corporate fundamentals with the operational parameters shown in the chart:
🏛️ 1. Fundamental Analysis (Long-Term Thesis)
Hedera stands out in the market for using Hashgraph technology instead of a traditional blockchain, and for having a governance council made up of major global corporations (Google, IBM, Dell, among others):
* Corporate Focus and RWA: The network is designed for high scalability, low fixed fees, and micropayments, and is widely used for institutional use cases and the tokenization of real-world assets.
* Long-Term View (Hodler): For investors focused on fundamentals, the current region reflects a recovery pivot. However, long-term value buys require patience during price retracement phases to avoid exposure to the volatility near the short-term top.
⚡ 2. Technical Analysis & Risk Management (Short-Term Operations)
From the perspective of the Trader/Swing Trader:
🟢 Support & Resistance Zones: The range of US$ 0,10 to US$ 0,11 acts as immediate support and psychological support. A bullish pivot confirmation on longer timeframes may open the path to seek previous resistances.
🛑 Risk Management (Stop Loss): Using a Stop Loss is essential. Place the technical stop just below the consolidation move’s bottom (e.g., daily or 4H chart time) to protect capital against a market reversal.
🎯 Exit Points (Take Profit): To control greed and secure the outcome, take partial profits as the price tests historical resistance regions.
The $HBAR token, Hedera’s native asset, is trading in the range of US$ 0,1181, accumulating a monthly gain of +57.2%. The historical chart shows the asset went through an extended accumulation phase in the previous years, and now it is attempting a meaningful recovery from its bottom.
To serve both institutional and retail audiences on Binance Square, the analysis should balance the project’s corporate fundamentals with the operational parameters shown in the chart:
🏛️ 1. Fundamental Analysis (Long-Term Thesis)
Hedera stands out in the market for using Hashgraph technology instead of a traditional blockchain, and for having a governance council made up of major global corporations (Google, IBM, Dell, among others):
* Corporate Focus and RWA: The network is designed for high scalability, low fixed fees, and micropayments, and is widely used for institutional use cases and the tokenization of real-world assets.
* Long-Term View (Hodler): For investors focused on fundamentals, the current region reflects a recovery pivot. However, long-term value buys require patience during price retracement phases to avoid exposure to the volatility near the short-term top.
⚡ 2. Technical Analysis & Risk Management (Short-Term Operations)
From the perspective of the Trader/Swing Trader:
🟢 Support & Resistance Zones: The range of US$ 0,10 to US$ 0,11 acts as immediate support and psychological support. A bullish pivot confirmation on longer timeframes may open the path to seek previous resistances.
🛑 Risk Management (Stop Loss): Using a Stop Loss is essential. Place the technical stop just below the consolidation move’s bottom (e.g., daily or 4H chart time) to protect capital against a market reversal.
🎯 Exit Points (Take Profit): To control greed and secure the outcome, take partial profits as the price tests historical resistance regions.