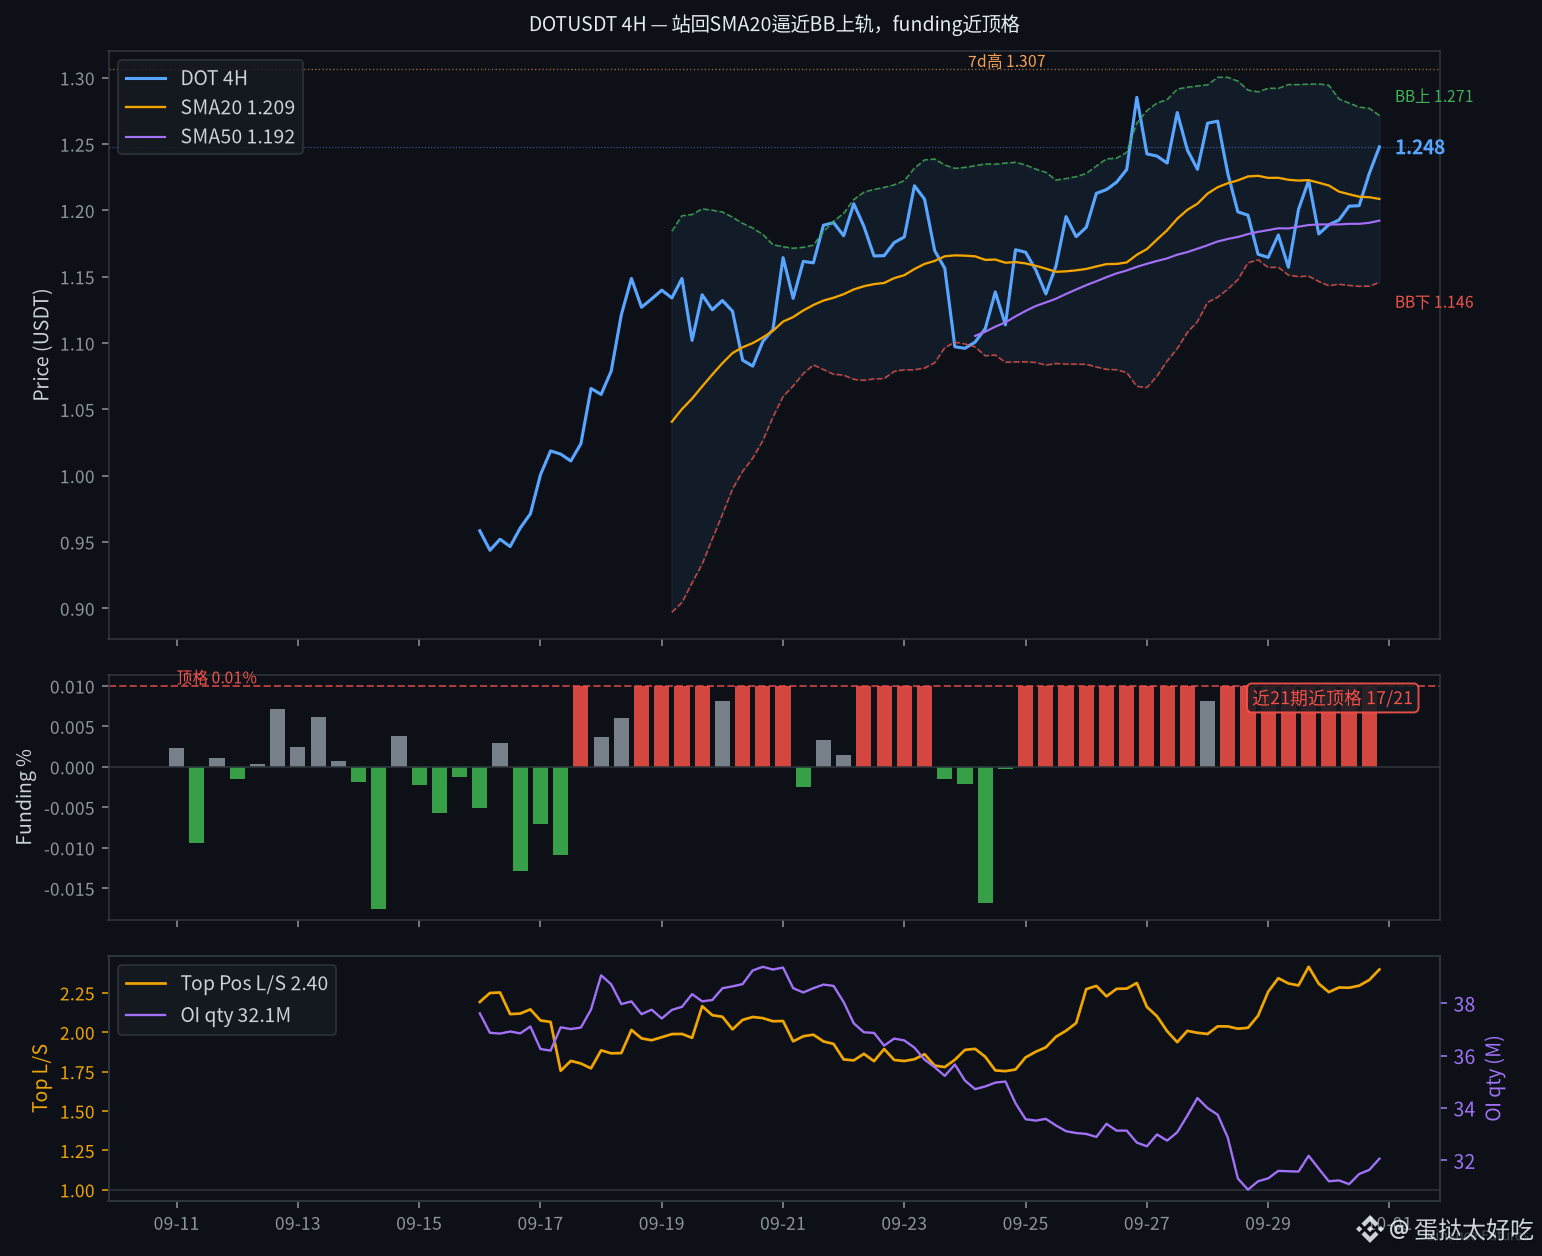
$DOT The rebound is not a squeeze liquidation—while longs pay top-tier rates, they add to positions.
In the last 21 periods, the funding rate was at the 0.01% cap in 17 of them (annualized roughly 11%). Recently, it has been directly throttled for multiple consecutive periods. Over the past 48 hours, large holders’ long/short ratio rose from 2.18 to 2.40 (70.6% long). Retail traders’ ratio moved from 1.73 up to 2.01. Price on the 4H chart rebounded back to the SMA20 (1.209), roughly 1.25 sitting right on top of the Bollinger upper band at 1.27.
However, OI (open interest) quantity over the past 7 days is still down 10%, and over the past 24 hours it only ticked up by 1.2%. The aggressive buy/sell ratio over the last 6 hours is 0.90, indicating order consumption is more bearish. Spot prices are rising along with it, and futures longs are paying fees to chase—this is not the typical short-squeeze crash driver.
Before the US session opens, this kind of rebound structure—"fee-rate cap ceiling + OI not expanding"—with the upper band at 1.27 and the 7-day high at 1.31: on a pullback, don’t lose 1.21. How far do you think this structure can still run?
$DOT #资金费率 #position size
In the last 21 periods, the funding rate was at the 0.01% cap in 17 of them (annualized roughly 11%). Recently, it has been directly throttled for multiple consecutive periods. Over the past 48 hours, large holders’ long/short ratio rose from 2.18 to 2.40 (70.6% long). Retail traders’ ratio moved from 1.73 up to 2.01. Price on the 4H chart rebounded back to the SMA20 (1.209), roughly 1.25 sitting right on top of the Bollinger upper band at 1.27.
However, OI (open interest) quantity over the past 7 days is still down 10%, and over the past 24 hours it only ticked up by 1.2%. The aggressive buy/sell ratio over the last 6 hours is 0.90, indicating order consumption is more bearish. Spot prices are rising along with it, and futures longs are paying fees to chase—this is not the typical short-squeeze crash driver.
Before the US session opens, this kind of rebound structure—"fee-rate cap ceiling + OI not expanding"—with the upper band at 1.27 and the 7-day high at 1.31: on a pullback, don’t lose 1.21. How far do you think this structure can still run?
$DOT #资金费率 #position size