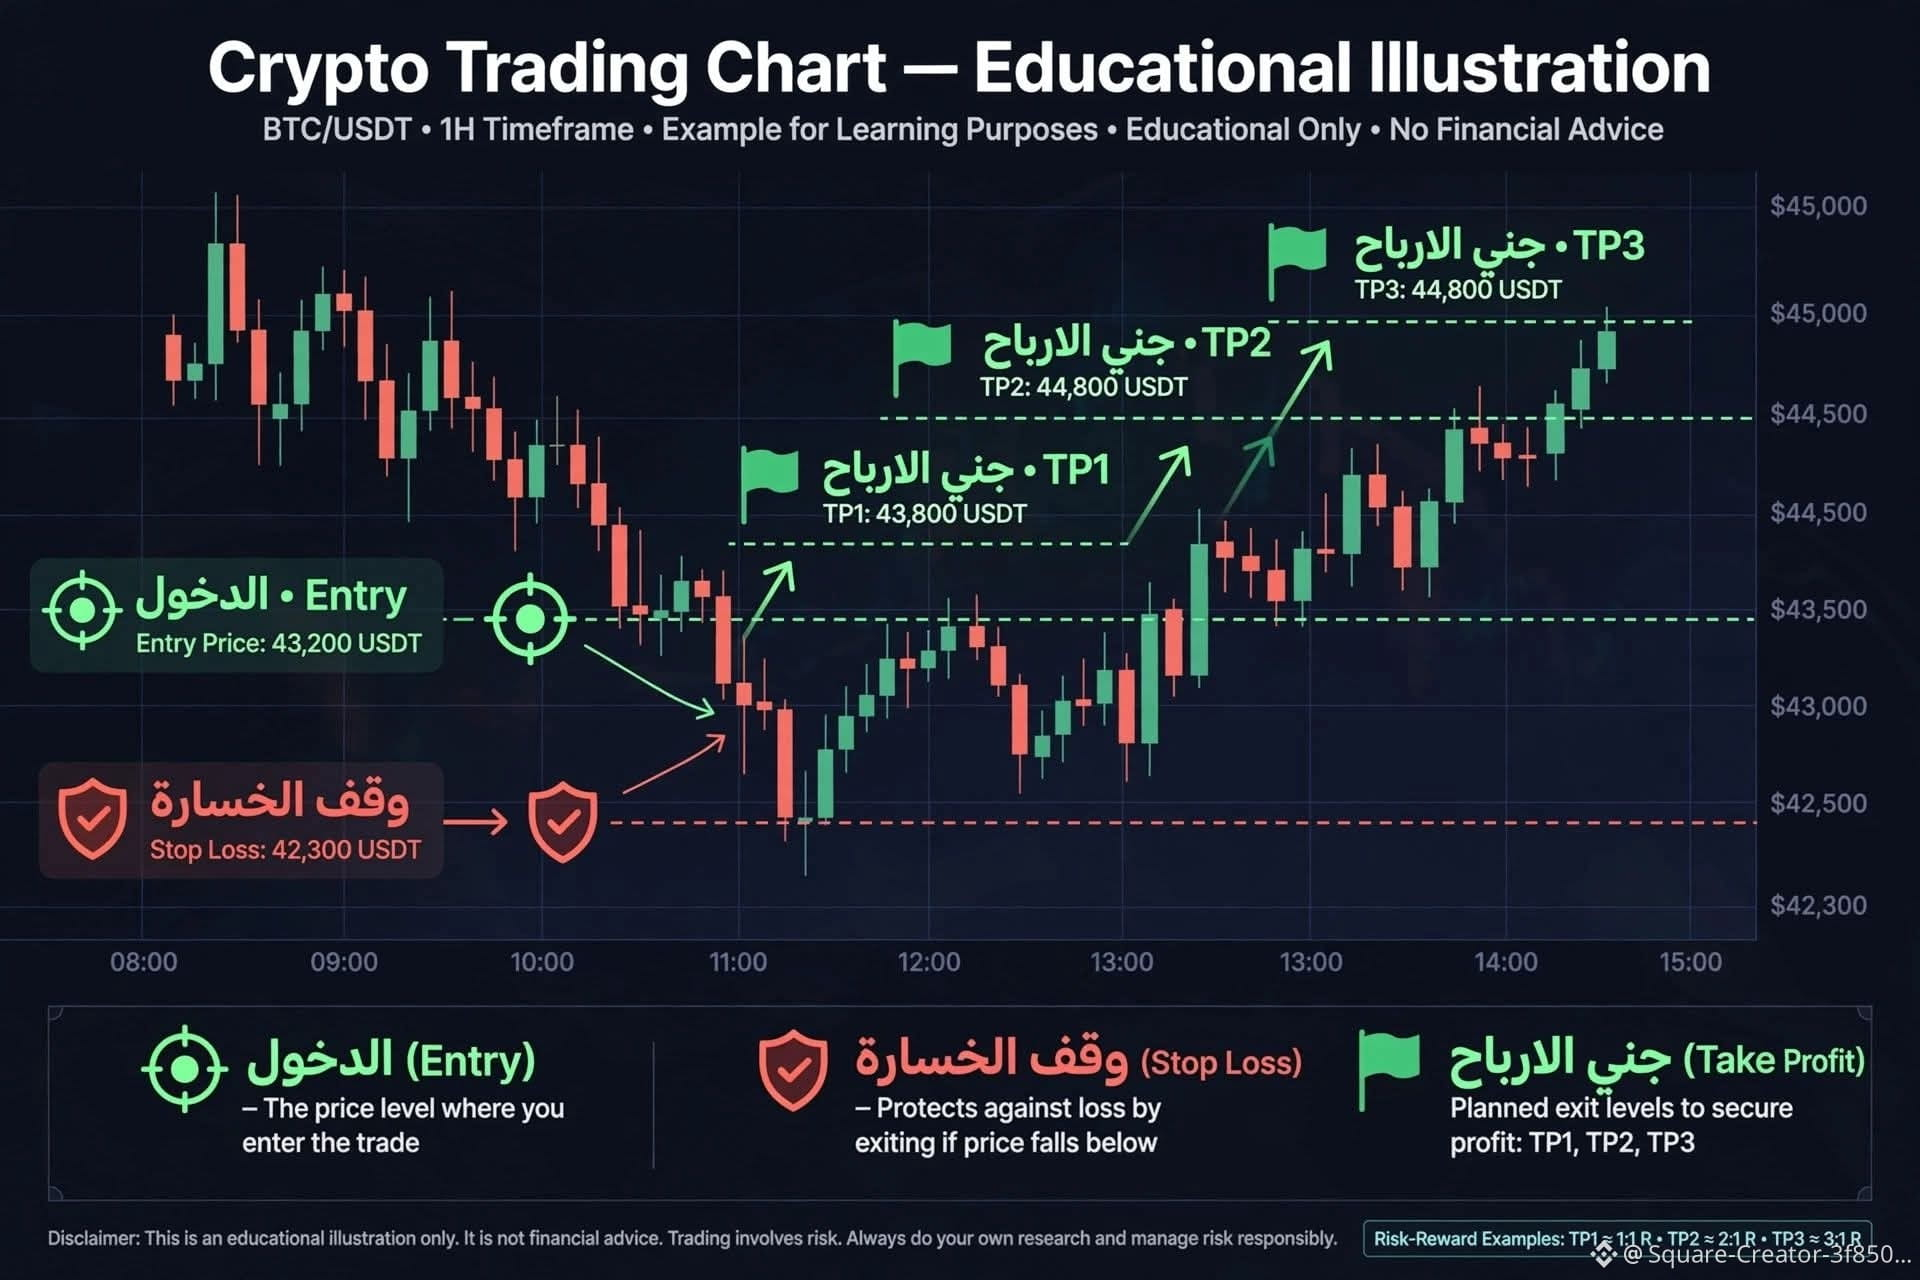
How do you read any analysis in one minute? 📊
Understand this picture and you’ll become professional 👇
🎯 Entry: 43,200
This is the price you enter the trade at
Its marker 🎯 is the green circle
🛡️ Stop Loss: 42,300
This is your line of defense. If the price drops to it, the trade will close automatically so you don’t lose too much
Its marker 🛡️ is the red shield
🚩 Take Profit:
TP1: 43,800
TP2: 44,500
TP3: 45,000
These are the targets where you take profit in stages
Its marker 🚩 is the green flag
Example: from entry 43,200 to stop 42,300, the risk is 900
If it reaches TP1, your profit-to-loss ratio will be about 1:1
⚠️ The image is for educational purposes only and is not trading advice
Save this post—you’ll need it while following any analyst 😉
#TradingEducation #Entry #StopLoss #TakeProfit #QNTRises287% #JapanMOFStudyGroupOnTokenizedGovtBonds
Understand this picture and you’ll become professional 👇
🎯 Entry: 43,200
This is the price you enter the trade at
Its marker 🎯 is the green circle
🛡️ Stop Loss: 42,300
This is your line of defense. If the price drops to it, the trade will close automatically so you don’t lose too much
Its marker 🛡️ is the red shield
🚩 Take Profit:
TP1: 43,800
TP2: 44,500
TP3: 45,000
These are the targets where you take profit in stages
Its marker 🚩 is the green flag
Example: from entry 43,200 to stop 42,300, the risk is 900
If it reaches TP1, your profit-to-loss ratio will be about 1:1
⚠️ The image is for educational purposes only and is not trading advice
Save this post—you’ll need it while following any analyst 😉
#TradingEducation #Entry #StopLoss #TakeProfit #QNTRises287% #JapanMOFStudyGroupOnTokenizedGovtBonds