🚨 PUMP/USDT : After +8%, is there another surge or a correction?
📊 Technical analysis | September 30, 2026
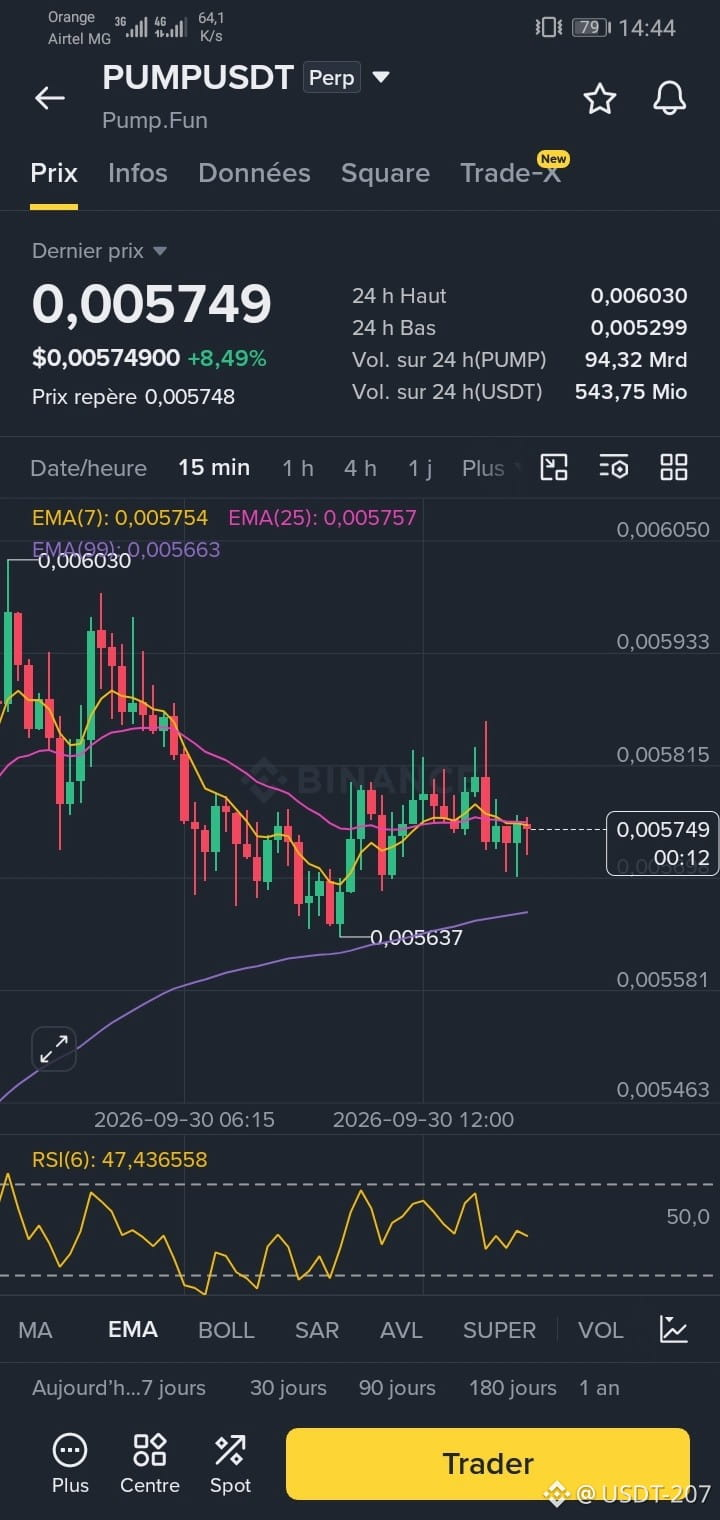
PUMP shows a significant rise, reaching a peak of 0.00603 USDT. Currently around 0.00575 USDT, the price appears to be entering a consolidation phase.
🔍 Technical analysis
📈 1H trend: the 7 and 25 EMAs remain above the 99 EMA. The overall trend is still bullish.
⚠️ RSI: around 47 on the 15-minute chart, it indicates neutral momentum. On the daily chart, it exceeds 75, signaling a potentially overbought market.
🎯 Key levels:
🔴 Resistance: 0.00603 USDT
🟢 Support: 0.00563–0.00566 USDT
🟡 Current price: 0.00575 USDT
📊 Two scenarios to watch:
🟢 Bullish: a breakout above 0.00603 USDT with significant volume could reignite the uptrend.
🔴 Bearish: a rejection under the resistance followed by a breakdown of the support could trigger a correction.
💡 Conclusion: PUMP is at an interesting point. The next breakout could provide a clue about the market direction. Caution is still advised after a strong rally.
⚠️ Technical analysis only. Not financial advice.
#PUMP #PUMPUSDT #Crypto #BinanceSquare #Trading #TechnicalAnalysis
📊 Technical analysis | September 30, 2026
PUMP shows a significant rise, reaching a peak of 0.00603 USDT. Currently around 0.00575 USDT, the price appears to be entering a consolidation phase.
🔍 Technical analysis
📈 1H trend: the 7 and 25 EMAs remain above the 99 EMA. The overall trend is still bullish.
⚠️ RSI: around 47 on the 15-minute chart, it indicates neutral momentum. On the daily chart, it exceeds 75, signaling a potentially overbought market.
🎯 Key levels:
🔴 Resistance: 0.00603 USDT
🟢 Support: 0.00563–0.00566 USDT
🟡 Current price: 0.00575 USDT
📊 Two scenarios to watch:
🟢 Bullish: a breakout above 0.00603 USDT with significant volume could reignite the uptrend.
🔴 Bearish: a rejection under the resistance followed by a breakdown of the support could trigger a correction.
💡 Conclusion: PUMP is at an interesting point. The next breakout could provide a clue about the market direction. Caution is still advised after a strong rally.
⚠️ Technical analysis only. Not financial advice.
#PUMP #PUMPUSDT #Crypto #BinanceSquare #Trading #TechnicalAnalysis