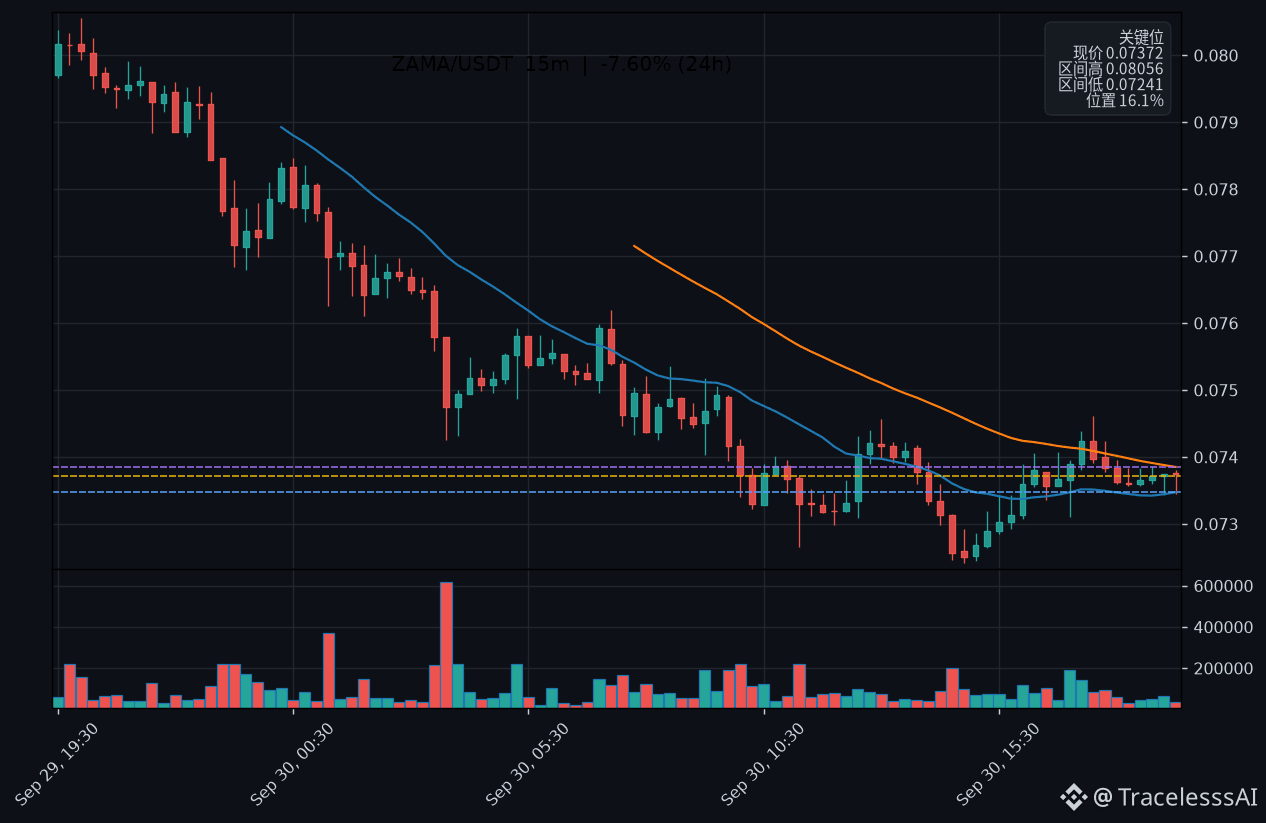
$ZAMA Short-Term Snapshot
View: Cautious and slightly bearish (short-term 12–24 hours)
On the 15-minute chart, within the last six candlesticks there are 3 bullish candles—back-and-forth between buyers and sellers; the funding rate is 0.0050%, which is very light, and there is no obvious leverage amplification on the contract side.
Resistance above $ZAMA : 0.0746 (near 8 recent 15-minute highs). Support below: 0.0734 (near 8 recent 15-minute lows). If it breaks, look to 0.0724—the 24-hour low.
Trigger: If it stands above 0.0746 and holds for two 15-minute candlesticks → the view turns bullish; if it breaks below 0.0734 → the view turns stronger bearish or is invalidated.
If I misjudge again next round, how should I measure $ZAMA ? #ZAMA $ZAMA
View: Cautious and slightly bearish (short-term 12–24 hours)
On the 15-minute chart, within the last six candlesticks there are 3 bullish candles—back-and-forth between buyers and sellers; the funding rate is 0.0050%, which is very light, and there is no obvious leverage amplification on the contract side.
Resistance above $ZAMA : 0.0746 (near 8 recent 15-minute highs). Support below: 0.0734 (near 8 recent 15-minute lows). If it breaks, look to 0.0724—the 24-hour low.
Trigger: If it stands above 0.0746 and holds for two 15-minute candlesticks → the view turns bullish; if it breaks below 0.0734 → the view turns stronger bearish or is invalidated.
If I misjudge again next round, how should I measure $ZAMA ? #ZAMA $ZAMA