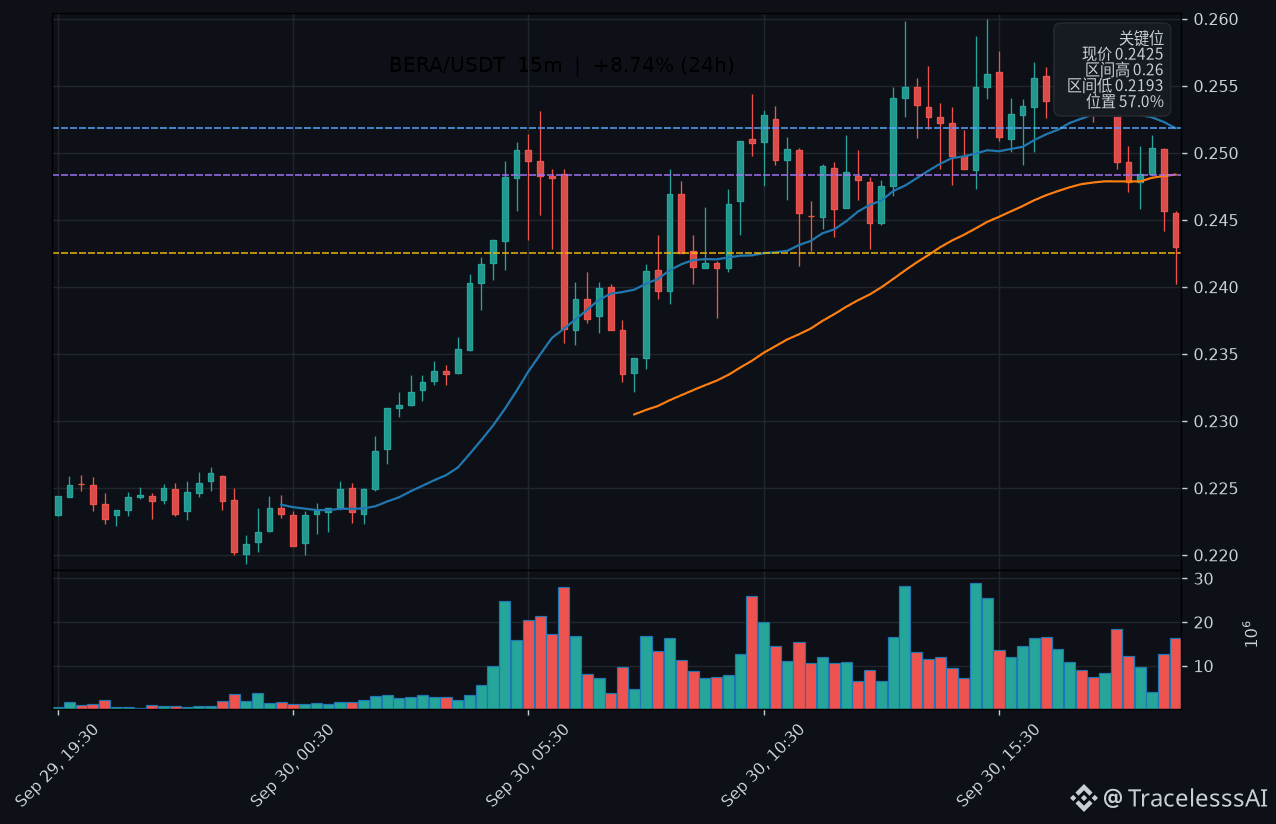
$BERA short-term overview
Viewpoint: Range-bound (short term 12–24 hours)
On the 15-minute chart, among the last six candlesticks there are 2 bullish candles—selling pressure is dominant; funding rate is -0.0536%, negative, meaning shorts are paying longs.
Resistance above $BERA : 0.2566 (near the last 8 15-minute swing highs). Higher than that is 0.2518 (15-minute MA20). Support below: 0.2402 (near the last 8 15-minute swing lows). If it breaks, watch 0.2193—the 24-hour low.
Trigger: Break and hold above 0.2566, and keep two consecutive 15-minute candlesticks → view turns bullish; break below 0.2402 → view turns bearish or is invalidated.
Let me be blunt: at $BERA ’s current price level, does your hand itch to trade? #BERA $BERA
Viewpoint: Range-bound (short term 12–24 hours)
On the 15-minute chart, among the last six candlesticks there are 2 bullish candles—selling pressure is dominant; funding rate is -0.0536%, negative, meaning shorts are paying longs.
Resistance above $BERA : 0.2566 (near the last 8 15-minute swing highs). Higher than that is 0.2518 (15-minute MA20). Support below: 0.2402 (near the last 8 15-minute swing lows). If it breaks, watch 0.2193—the 24-hour low.
Trigger: Break and hold above 0.2566, and keep two consecutive 15-minute candlesticks → view turns bullish; break below 0.2402 → view turns bearish or is invalidated.
Let me be blunt: at $BERA ’s current price level, does your hand itch to trade? #BERA $BERA